8-K
false0001580560MA00015805602026-08-042026-08-04
UNITED STATES
SECURITIES AND EXCHANGE COMMISSION
Washington, D.C. 20549
FORM 8-K
CURRENT REPORT
Pursuant to Section 13 or 15(d)
of the Securities Exchange Act of 1934
Date of Report (Date of earliest event reported): August 4, 2026
FLYWIRE CORPORATION
(Exact name of Registrant as specified in its charter)
|
|
|
Delaware |
001-40430 |
27-0690799 |
(State or other jurisdiction of incorporation) |
(Commission File No.) |
(IRS Employer Identification No.) |
|
|
141 Tremont St #10 |
Boston, MA 02111 |
(Address of principal executive offices and zip code) |
Registrant’s telephone number, including area code: (617) 329-4524
Not Applicable
(Former Name or Former Address, if Changed Since Last Report)
Check the appropriate box below if the Form 8-K filing is intended to simultaneously satisfy the filing obligation of the registrant under any of the following provisions:
|
|
☐ |
Written communications pursuant to Rule 425 under the Securities Act (17 CFR 230.425) |
|
|
☐ |
Soliciting material pursuant to Rule 14a-12 under the Exchange Act (17 CFR 240.14a-12) |
|
|
☐ |
Pre-commencement communications pursuant to Rule 14d-2(b) under the Exchange Act (17 CFR 240.14d-2(b)) |
|
|
☐ |
Pre-commencement communications pursuant to Rule 13e-4(c) under the Exchange Act (17 CFR 240.13e-4(c)) |
Securities registered pursuant to Section 12(b) of the Act:
|
|
|
Title of each class |
Trading
Symbol(s) |
Name of each exchange on which registered |
Voting Common Stock, $0.0001 par value per share |
FLYW |
The Nasdaq Stock Market LLC (Nasdaq Global Select Market) |
Indicate by check mark whether the registrant is an emerging growth company as defined in Rule 405 of the Securities Act of 1933 (§230.405 of this chapter) or Rule 12b-2 of the Securities Exchange Act of 1934 (§240.12b-2 of this chapter).
Emerging growth company ☐
If an emerging growth company, indicate by check mark if the registrant has elected not to use the extended transition period for complying with any new or revised financial accounting standards provided pursuant to Section 13(a) of the Exchange Act. ☐
|
|
Item 2.02. |
Results of Operations and Financial Condition. |
On August 4, 2026, Flywire Corporation (“Flywire” or the “Company”) issued a press release (the “Press Release”) and is holding a conference call regarding its preliminary and unaudited financial results for the quarter ended June 30, 2026. The Press Release is furnished as Exhibit 99.1 to this Current Report on Form 8-K and is incorporated by reference herein.
Various statements to be made during the conference call are “forward-looking statements” within the meaning of the Private Securities Litigation Reform Act of 1995, including, but not limited to, statements regarding Flywire’s future operating results and financial position, Flywire’s business strategy and plans, market growth, and Flywire’s objectives for future operations. Flywire intends such forward-looking statements to be covered by the safe harbor provisions for forward-looking statements contained in Section 21E of the Securities Exchange Act of 1934 and the Private Securities Litigation Reform Act of 1995. In some cases, you can identify forward-looking statements by terms such as, but not limited to, “believe,” “may,” “will,” “potentially,” “estimate,” “continue,” “anticipate,” “intend,” “could,” “would,” “project,” “target,” “plan,” “expect,” or the negative of these terms, and similar expressions intended to identify forward-looking statements. Such forward-looking statements are based upon current expectations that involve risks, changes in circumstances, assumptions, and uncertainties. Important factors that could cause actual results to differ materially from those reflected in Flywire’s forward-looking statements include, among others, Flywire’s future financial performance, including its expectations regarding FX Neutral Revenue Less Ancillary Services growth, Adjusted EBITDA margin growth and foreign exchange rates. Risks that may cause actual results to differ materially from these forward looking statements include, but are not limited to: Flywire’s ability to execute its business plan and effectively manage its growth; Flywire’s cross-border expansion plans and ability to expand internationally; anticipated trends, growth rates, and challenges in Flywire’s business and in the markets in which Flywire operates; the sufficiency of Flywire’s cash and cash equivalents to meet its liquidity needs; political, economic, foreign currency exchange rate, inflation, legal, social and health risks, that may affect Flywire’s business or the global economy; Flywire’s beliefs and objectives for future operations; Flywire’s ability to develop and protect its brand; Flywire’s ability to maintain and grow the payment volume that it processes; Flywire’s ability to further attract, retain, and expand its client base; Flywire’s ability to develop new solutions and services and bring them to market in a timely manner; Flywire’s expectations concerning relationships with third parties, including financial institutions and strategic partners; the effects of increased competition in Flywire’s markets and its ability to compete effectively; recent and future acquisitions or investments in complementary companies, products, services, or technologies; uncertainties associated with the timing and scope of future repurchases by FLYW of its common stock under its repurchase program, which may be discontinued, accelerated, suspended or delayed at any time due to various factors, including market conditions and the level of other investing activities and uses of cash; Flywire’s ability to enter new client verticals, including its relatively new hospitality sector; Flywire’s expectations regarding anticipated technology needs and developments and its ability to address those needs and developments with its solutions; Flywire’s ability to implement its technology and systems transformation program; Flywire’s expectations regarding its ability to meet existing performance obligations and maintain the operability of its solutions; Flywire’s expectations regarding the effects of existing and developing laws and regulations, including with respect to payments and financial services, taxation, privacy and data protection; Flywire’s ability to adapt its business to changes in government policy regarding tariffs and immigration; economic and industry trends, including the risk of a global recession, projected growth, or trend analysis; the effects of global events and geopolitical conflicts, including without limitation the ongoing hostilities in Ukraine and involving Israel, Hamas and Iran; Flywire’s ability to adapt to recommended or implemented U.S. policy changes, in particular those that impact higher education, the desire for foreign students to study in the U.S., immigration and visa policy, and changes to regulatory agencies and depth of enforcement of regulations; Flywire’s ability to adapt to changes in U.S. federal income or other tax laws or the interpretation of tax laws, including the Inflation Reduction Act of 2022 and The One Big Beautiful Bill Act of 2025; Flywire’s ability to attract and retain qualified employees; Flywire’s ability to maintain, protect, and enhance its intellectual property; Flywire’s ability to maintain the security and availability of its solutions; the increased expenses associated with being a public company; the future market price of Flywire’s common stock; and other factors that are described in the “Risk Factors” and “Management’s Discussion and Analysis of Financial Condition and Results of Operations” sections of Flywire’s Annual Report on Form 10-K for the year ended December 31, 2025 and Quarterly Report on Form 10-Q for the quarter ended March 31, 2026, which are on file with the Securities and Exchange Commission (SEC) and available on the SEC’s website at https://www.sec.gov/. Additional factors may be described in those sections of Flywire’s Quarterly Report on Form 10-Q for the quarter ended June 30, 2026, expected to be filed in the third quarter of 2026. The information conveyed on the conference call is provided only as of the date of the conference call, and Flywire undertakes no obligation to update any forward-looking statements presented during the conference call on account of new information, future events, or otherwise, except as required by law.
|
|
Item 7.01. |
Regulation FD Disclosure. |
On August 4, 2026, the Company provided an investor presentation that will be made available on the investor relations section of the Company’s website at https://ir.flywire.com/. The investor presentation is furnished as Exhibit 99.2 to this Current Report on Form 8-K and is incorporated by reference herein.
This information in this Item 7.01 of this Current Report on Form 8-K shall not be deemed “filed” for purposes of Section 18 of the Securities Exchange Act of 1934, as amended (the “Exchange Act”), or otherwise subject to the liabilities of that Section, or incorporated by reference in any filing under the Securities Act of 1933, as amended, or the Exchange Act, except as shall be expressly set forth by specific reference in any such filing.
|
|
Item 9.01. |
Financial Statements and Exhibits. |
(d) Exhibits
SIGNATURE
Pursuant to the requirements of the Securities Exchange Act of 1934, the registrant has duly caused this report to be signed on its behalf by the undersigned hereunto duly authorized.
|
|
|
|
|
|
FLYWIRE CORPORATION |
|
|
By: |
|
/s/ Cosmin Pitigoi |
Name: |
|
Cosmin Pitigoi |
Title: |
|
Chief Financial Officer |
Dated August 4, 2026
EX-99.1
Exhibit 99.1
Flywire Reports Second Quarter 2026 Financial Results
Second Quarter Revenue Increased 27.2% Year-over-Year
Second Quarter Revenue Less Ancillary Services Increased 28.5% Year-over-Year
Previous Fiscal Year 2026 FX-Neutral Revenue Less Ancillary Services growth guidance raised by 300 bps at midpoint, Adjusted EBITDA margin growth guidance raised by 25 bps at midpoint
Boston, MA – August 4, 2026: Flywire Corporation (Nasdaq: FLYW) (“Flywire” or the “Company”), a global payments enablement and software company, today reported financial results for its second quarter ended June 30, 2026.
“Q2 was another strong quarter for Flywire, with results ahead of expectations and momentum building across all four verticals. We are signing larger accounts, expanding faster within existing ones, unifying our global platforms, and bringing agentic capabilities to market that will meaningfully improve the experience for our clients and their payers. The financial profile reflects it: revenue growth, expanding adjusted EBITDA margins, and growing free cash flow. The complexity we solve is our moat, and everything we are building today is a foundation for our path to $1 billion in revenue and 30% adjusted EBITDA margin," said Mike Massaro, Flywire’s CEO.
Second Quarter 2026 Financial Highlights:
GAAP Results
●Revenue increased 27.2% to $167.7 million in the Second quarter of 2026, compared to $131.9 million in the Second quarter of 2025.
●Gross Profit increased to $89.6 million, resulting in Gross Margin of 53.4%, for the Second quarter of 2026, compared to Gross Profit of $75.1 million and Gross Margin of 57.0% in the Second quarter of 2025.
●Net loss was ($8.1) million in the Second quarter of 2026, compared to net loss of ($12.0) million in the Second quarter of 2025.
Key Operating Metrics and Non-GAAP Results
●Total Payment Volume increased 38.2% to $8.2 billion in the Second quarter of 2026, compared to $5.9 billion in the Second quarter of 2025.
●Revenue Less Ancillary Services increased 28.5% to $163.8 million in the Second quarter of 2026, compared to $127.5 million in the Second quarter of 2025. FX-Neutral Revenue Less Ancillary Services increased 26.9% year-over-year.
●Adjusted Gross Profit increased to $92.7 million, up 19.0% compared to $77.9 million in the Second quarter of 2025. Adjusted Gross Margin was 56.6% in the Second quarter of 2026 compared to 61.1% in the Second quarter of 2025.
●Adjusted EBITDA increased 44.5% to $24.0 million in the Second quarter of 2026, compared to $16.6 million in the Second quarter of 2025. Adjusted EBITDA margin increased by approximately 160 bps year-over-year to 14.6% in the Second quarter of 2026.
●Repurchased approximately 3.1 million shares of our common stock for approximately $49 million (excluding commissions), with approximately $123 million remaining in the share repurchase program as of the end of the Second quarter of 2026.
Q2 2026 Key Business Performance highlights:
Commercial Highlights
-Significant Enterprise Wins Across Regions: Closed marquee deals including a major EMEA cross-border expansion, landmark UK university platform consolidation, multiple US institutional full-suite implementations, and Canada cross-border expansion.
-SFS-Driven Education Expansion: Student Financial Services expansion in the US and UK continues our shift toward larger, more strategic engagements. We signed three new US SFS deals this quarter at double the ARR of the prior-year quarter, and added the University of Liverpool in the UK to consolidate manual workflows onto a single platform.
-Strong Deal Velocity & Geographic Diversification: We signed 200+ new clients across 45 countries and all verticals — a second straight quarter at this pace. Education revenue outside our "Big Four" markets grew 30%+ YoY, with roughly two of three new education clients coming from outside those core markets.
-Travel Momentum. In Experiential Travel, deal sizes rose as travel clients consolidated vendors onto our rails, and we signed 42 Hospitality software deals across Europe and Asia in the first half of 2026.
Client, Product & Partner Highlights
-Workday Integration Advancement (EDU): Wesleyan University went live as the first SFS school using Flywire's new Workday Student Integration API. As the first existing SFS client to migrate between two integrated ERPs, Wesleyan's implementation established a framework for future ERP transitions.
-Driftwood Hospitality Deployment: Expanded Travel Hospitality footprint with deployment across nearly 90 US hotel properties, demonstrating strong traction in the higher-value hospitality segment with integrated payments, digital signatures, and authorization workflows.
Guidance
”Our second-quarter results give us the confidence to raise our full-year guidance for revenue and adjusted EBITDA, even as we remain prudent in our assumptions for the education vertical given the visa policy environment," said Flywire's CFO, Cosmin Pitigoi. “What's equally encouraging is what we see inside the P&L: operating expenses are scaling well below gross profit growth, which gives us conviction in our ability to scale profitably from here and achieve a fourfold increase in GAAP Net Income this year.”
Based on information available as of August 4, 2026, Flywire anticipates the following results for the third quarter and fiscal year 2026*.
|
|
|
Fiscal Year 2026 |
FX-Neutral Revenue Less Ancillary Services Growth |
21-27% YoY |
Adjusted EBITDA Margin Growth |
+200 to 400 bps YoY |
|
|
|
Third Quarter 2026 |
FX-Neutral Revenue Less Ancillary Services Growth |
16-22% YoY |
Adjusted EBITDA Margin Growth |
100-300 bps YoY |
*Flywire has not provided a quantitative reconciliation of forecasted FX-Neutral Revenue Less Ancillary Services Growth to forecasted GAAP Revenue Growth or forecasted Adjusted EBITDA Margin Growth to forecasted GAAP Net Income Margin Growth or to forecasted GAAP net income (loss) before income taxes growth within this earnings release because Flywire is unable, without making unreasonable efforts, to calculate certain reconciling items with confidence. These items include, but are not limited to, income taxes, which are directly impacted by unpredictable fluctuations in the market price of Flywire's stock and foreign currency exchange rates.
These statements are forward-looking, and actual results may differ materially. Refer to the “Safe Harbor Statement” below for information on the factors that could cause Flywire’s actual results to differ materially from these forward-looking statements.
Conference Call
The Company will host a conference call to discuss second quarter financial results today at 5:00 pm ET. Hosting the call will be Mike Massaro, CEO, Rob Orgel, President and COO, and Cosmin Pitigoi, CFO. The conference call can be accessed live via webcast from the Company's investor relations website at https://ir.flywire.com/. A replay will be available on the investor relations website following the call.
Note Regarding Share Repurchase Program
Repurchases under the Company’s share repurchase program (the Repurchase Program) may be made from time to time through open market purchases, in privately negotiated transactions or by other means, including through accelerated share repurchase transactions or the use of trading plans intended to qualify under Rule 10b5-1 under the Securities Exchange Act of 1934, as amended, in accordance with applicable securities laws and other restrictions, including Rule 10b-18. The timing, value and number of shares repurchased will be determined by the Company in its discretion and will be based on various factors, including an evaluation of current and future capital needs, current and forecasted cash flows, the Company’s capital structure, cost of capital and prevailing stock prices, general market and economic conditions, applicable legal requirements, and compliance with covenants in the Company’s credit facility that may limit share repurchases based on defined leverage ratios. The Repurchase Program does not obligate the Company to purchase a specific number of, or any, shares. The Repurchase Program does not expire and may be modified, suspended, or terminated at any time without notice at the Company’s discretion.
Key Operating Metrics and Non-GAAP Financial Measures
Flywire uses non-GAAP financial measures to supplement financial information presented on a GAAP basis. The Company believes that excluding certain items from its GAAP results allows management to better understand its consolidated financial performance from period to period and better project its future consolidated financial performance as forecasts are developed at a level of detail different from that used to prepare GAAP-based financial measures. Moreover, Flywire believes these non-GAAP financial measures provide its stakeholders with useful information to help them evaluate the Company’s operating results by facilitating an enhanced understanding of the Company’s operating performance and enabling them to make more meaningful period-to-period comparisons. There are limitations to the use of the non-GAAP financial measures presented here. Flywire’s non-GAAP financial measures may not be comparable to similarly titled measures of other companies. Other companies, including companies in Flywire’s industry, may calculate non-GAAP financial measures differently, limiting the usefulness of those measures for comparative purposes.
Flywire uses supplemental measures of its performance, which are derived from its consolidated financial information, but which are not presented in its consolidated financial
statements prepared in accordance with GAAP. These non-GAAP financial measures include the following:
●Revenue Less Ancillary Services. Revenue Less Ancillary Services represents the Company’s consolidated revenue in accordance with GAAP less (i) pass-through cost for printing and mailing services and (ii) marketing fees. The Company excludes these amounts to arrive at this supplemental non-GAAP financial measure as it views these services as ancillary to the primary services it provides to its clients.
●Adjusted Gross Profit and Adjusted Gross Margin. Adjusted gross profit represents Revenue Less Ancillary Services less cost of revenue adjusted to (i) exclude pass-through cost for printing services, (ii) offset marketing fees against costs incurred and (iii) exclude depreciation and amortization, including accelerated amortization on the impairment of customer set-up costs tied to technology integration, if applicable. Adjusted Gross Margin represents Adjusted Gross Profit divided by Revenue Less Ancillary Services. Management believes this presentation supplements the GAAP presentation of Gross Profit and Gross Margin with a useful measure of the gross profit and gross margin of the Company’s payment processing-related services, which are the primary services it provides to its clients.
●Adjusted EBITDA. EBITDA represents our consolidated net income (loss) in accordance with GAAP adjusted to exclude (i) interest expense, (ii) interest income, (iii) (benefit from) provision for income taxes and (iv) depreciation and amortization. Adjusted EBITDA represents EBITDA further adjusted by excluding (a) stock-based compensation expense and related payroll taxes, (b) the impact from the change in fair value measurement for contingent consideration associated with acquisitions,(c) gain (loss) from the remeasurement of foreign currency, (d) indirect taxes related to intercompany activity, (e) acquisition related transaction costs, (f) employee retention costs, such as incentive compensation, associated with acquisition activities, (g) restructuring costs, and (h) gain (loss) from investments. Management believes that the exclusion of these amounts to calculate Adjusted EBITDA provides useful measures for period-to-period comparisons of the Company’s business.
●Adjusted EBITDA Margin. Adjusted EBITDA Margin represents Adjusted EBITDA divided by Revenue Less Ancillary Services. Management believes this presentation supplements the GAAP presentation of gross margin with a useful measure of the gross margin of the Company’s payment processing-related services, which are the primary services it provides to its clients.
●FX Neutral Revenue Less Ancillary Services. FX Neutral Revenue Less Ancillary Services represents Revenue Less Ancillary Services adjusted to show presentation on a FX Neutral basis. The FX Neutral information presented is calculated by translating current-period results using prior-period weighted average foreign currency exchange rates. Flywire analyzes Revenue Less Ancillary Services on an FX Neutral basis to provide a comparable framework for assessing how the business performed, excluding the effect of foreign currency fluctuations.
●Non-GAAP Operating Expenses. Non-GAAP Operating Expenses represents GAAP Operating Expenses adjusted by excluding (i) stock-based compensation expense and related payroll taxes, (ii) depreciation and amortization, (iii) acquisition related transaction costs, if applicable, (iv) employee retention costs, such as incentive compensation, associated with acquisition activities, (v) the impact from the change in fair value measurement for contingent consideration associated with acquisitions and (vi) restructuring costs.
These non-GAAP financial measures are not meant to be considered as indicators of performance in isolation from or as a substitute for the Company’s revenue, gross profit, gross margin or net income (loss), or operating expenses prepared in accordance with GAAP and should be read only in conjunction with financial information presented on a GAAP basis. Reconciliations of these non-GAAP financial measures to the most directly comparable GAAP financial measure are presented below. Flywire encourages you to review these reconciliations in conjunction with the presentation of the non-GAAP financial measures for each of the periods presented. In future fiscal periods, Flywire may exclude such items and may incur income and expenses similar to these excluded items.
Flywire has not provided a quantitative reconciliation of forecasted FX-Neutral Revenue Less Ancillary Services Growth to forecasted GAAP Revenue Growth or forecasted Adjusted EBITDA Margin Growth to forecasted GAAP Net Income Margin Growth or to forecasted GAAP net income (loss) before income taxes growth within this earnings release because it is unable, without making unreasonable efforts, to calculate certain reconciling items with confidence. These items include, but are not limited to, income taxes, which are directly impacted by unpredictable fluctuations in the market price of Flywire's stock and foreign currency exchange rates. For figures in this press release reported on an "FX-Neutral basis,” Flywire calculates the year-over-year impact of foreign currency movements using prior period weighted average foreign currency exchange rates.
About Flywire
Flywire is a global payments enablement and software company. We combine our proprietary global payments network, next-gen payments platform and vertical-specific software to deliver the most important and complex payments for our clients and their customers.
Flywire leverages its vertical-specific software and payments technology to deeply embed within the existing A/R workflows for its clients across the education, healthcare, and travel vertical markets, as well as in key B2B industries. Flywire also integrates with leading ERP systems, such as NetSuite, so organizations can optimize the payment experience for their customers while eliminating operational challenges.
Flywire supports approximately 5,300** clients with diverse payment methods in more than 140 currencies across more than 240 countries and territories around the world. Flywire is headquartered in Boston, MA, USA, with global offices. For more information, visit www.flywire.com. Follow Flywire on X (formerly known as Twitter), LinkedIn and Facebook.
**Excludes clients from Flywire’s Sertifi and Invoiced acquisitions
Safe Harbor Statement
This release contains forward-looking statements within the meaning of the Private Securities Litigation Reform Act of 1995, including, but not limited to, statements regarding Flywire’s future operating results and financial position, Flywire’s business strategy and plans, market growth, and Flywire’s objectives for future operations. Flywire intends such forward-looking statements to be covered by the safe harbor provisions for forward-looking statements contained in Section 21E of the Securities Exchange Act of 1934 and the Private Securities Litigation Reform Act of 1995. In some cases, you can identify forward-looking statements by terms such as, but not limited to, “believe,” “may,” “will,” “potentially,” “estimate,” “continue,” “anticipate,” “intend,” “could,” “would,” “project,” “target,” “plan,” “expect,” or the negative of these terms, and similar expressions intended to identify forward-looking statements. Such forward-looking statements are based upon current expectations that involve risks, changes in circumstances, assumptions, and uncertainties. Important factors that could cause actual results to differ materially from those reflected in Flywire's forward-looking statements include, among others, Flywire’s future financial performance, including its expectations regarding FX Neutral Revenue Less Ancillary Services growth, Adjusted EBITDA margin growth and foreign exchange rates. Risks that may cause actual results to differ materially from these forward looking statements include, but are not limited to: Flywire’s ability to execute its business plan and effectively manage its growth; Flywire’s cross-border expansion plans and ability to expand internationally; anticipated trends, growth rates, and challenges in Flywire’s business and in the markets in which Flywire operates; the sufficiency of Flywire’s cash and cash equivalents to meet its liquidity needs; political, economic, foreign currency exchange rate, inflation, legal, social and health risks, that may affect Flywire’s business or the global economy; Flywire’s beliefs and objectives for future operations; Flywire’s ability to develop and protect its brand; Flywire’s ability to maintain and grow the payment volume that it processes; Flywire’s ability to further attract, retain, and expand its client base; Flywire’s ability to develop new solutions and services and bring them to market in a timely manner; Flywire’s expectations concerning relationships with third parties, including financial institutions and strategic partners; the effects of increased competition in Flywire’s markets and its ability to compete effectively; recent and future acquisitions or investments in complementary companies, products, services, or technologies; uncertainties associated with the timing and scope of future repurchases by FLYW of its common stock under its repurchase program, which may be discontinued, accelerated, suspended or delayed at any time due to various factors, including market conditions and the level of other investing activities and uses of cash; Flywire’s ability to enter new client verticals, including its relatively new hospitality sector; Flywire’s expectations regarding anticipated technology needs and developments and its ability to address those needs and developments with its solutions; Flywire’s expectations regarding its ability to meet existing performance obligations and maintain the operability of its solutions; Flywire’s expectations regarding the effects of existing and developing laws and regulations, including with respect to payments and financial services, taxation, privacy and data protection; Flywire’s ability to adapt its business to changes in government policy regarding tariffs and immigration; economic and industry trends, including the risk of a global recession, projected growth, or trend analysis; the effects of global events and geopolitical conflicts, including without limitation the ongoing hostilities in Ukraine and involving Israel, Hamas and Iran; Flywire’s ability to adapt to recommended or implemented U.S. policy changes, in particular those that impact higher education, the desire for foreign students to
study in the U.S., immigration and visa policy, and changes to regulatory agencies and depth of enforcement of regulations; Flywire’s ability to adapt to changes in U.S. federal income or other tax laws or the interpretation of tax laws, including the Inflation Reduction Act of 2022 and The One Big Beautiful Bill Act of 2025; Flywire’s ability to attract and retain qualified employees; Flywire’s ability to maintain, protect, and enhance its intellectual property; Flywire’s ability to maintain the security and availability of its solutions; the increased expenses associated with being a public company; the future market price of Flywire’s common stock; and other factors that are described in the "Risk Factors" and "Management's Discussion and Analysis of Financial Condition and Results of Operations" sections of Flywire's Annual Report on Form 10-K for the year ended December 31, 2025 and Quarterly Report on Form 10-Q for the quarter ended March 31, 2026, which are on file with the Securities and Exchange Commission (SEC) and available on the SEC's website at https://www.sec.gov/. Additional factors may be described in those sections of Flywire’s Quarterly Report on Form 10-Q for the quarter ended June 30, 2026, expected to be filed in the third quarter of 2026. The information in this release is provided only as of the date of this release, and Flywire undertakes no obligation to update any forward-looking statements contained in this release on account of new information, future events, or otherwise, except as required by law.
Contacts
Investor Relations:
Masha Kahn
ir@Flywire.com
Media:
Sarah King
Media@Flywire.com
Condensed Consolidated Statements of Operations and Comprehensive (Loss) Income
(Unaudited) (Amounts in thousands, except share and per share amounts)
|
|
|
|
|
|
|
|
|
|
|
|
|
|
|
Three Months Ended June 30, |
|
Six Months Ended June 30, |
|
|
2026 |
|
2025 |
|
2026 |
|
2025 |
Revenue |
|
$ |
167,744 |
|
$ |
131,891 |
|
$ |
355,856 |
|
$ |
265,343 |
Costs and operating expenses: |
|
|
|
|
|
|
|
|
|
|
|
|
Payment processing services costs |
|
|
74,748 |
|
|
53,887 |
|
|
152,199 |
|
|
104,450 |
Technology and development |
|
|
18,387 |
|
|
17,106 |
|
|
37,819 |
|
|
34,017 |
Selling and marketing |
|
|
38,913 |
|
|
38,377 |
|
|
79,407 |
|
|
74,946 |
General and administrative |
|
|
38,467 |
|
|
30,175 |
|
|
78,420 |
|
|
63,233 |
Restructuring |
|
|
— |
|
|
1,351 |
|
|
— |
|
|
8,690 |
Total costs and operating expenses |
|
|
170,515 |
|
|
140,896 |
|
|
347,845 |
|
|
285,336 |
(Loss) income from operations |
|
$ |
(2,771) |
|
$ |
(9,005) |
|
$ |
8,011 |
|
$ |
(19,993) |
Other income (expense): |
|
|
|
|
|
|
|
|
|
|
|
|
Interest expense |
|
|
(312) |
|
|
(1,065) |
|
|
(615) |
|
|
(1,789) |
Interest income |
|
|
656 |
|
|
1,089 |
|
|
1,571 |
|
|
4,023 |
(Loss) gain from remeasurement of foreign currency |
|
|
(2,890) |
|
|
3,947 |
|
|
404 |
|
|
7,523 |
Gain on available-for-sale debt securities |
|
|
— |
|
|
8 |
|
|
— |
|
|
166 |
Total other income (expense), net |
|
|
(2,546) |
|
|
3,979 |
|
|
1,360 |
|
|
9,923 |
(Loss) income before income taxes |
|
|
(5,317) |
|
|
(5,026) |
|
|
9,371 |
|
|
(10,070) |
Provision for income taxes |
|
|
2,830 |
|
|
6,981 |
|
|
5,000 |
|
|
6,097 |
Net (loss) income |
|
$ |
(8,147) |
|
$ |
(12,007) |
|
$ |
4,371 |
|
$ |
(16,167) |
Foreign currency translation adjustment |
|
|
2,877 |
|
|
6,655 |
|
|
1,976 |
|
|
9,332 |
Unrealized losses on available-for-sale debt securities, net of taxes |
|
|
(13) |
|
|
(36) |
|
|
(47) |
|
|
(165) |
Total other comprehensive income |
|
$ |
2,864 |
|
$ |
6,619 |
|
$ |
1,929 |
|
$ |
9,167 |
Comprehensive (loss) income |
|
$ |
(5,283) |
|
$ |
(5,388) |
|
$ |
6,300 |
|
$ |
(7,000) |
Net (loss) income attributable to common stockholders – basic and diluted |
|
$ |
(8,147) |
|
$ |
(12,007) |
|
$ |
4,371 |
|
$ |
(16,167) |
Net (loss) income per share attributable to common stockholders – basic |
|
$ |
(0.07) |
|
$ |
(0.10) |
|
$ |
0.04 |
|
$ |
(0.13) |
Net (loss) income per share attributable to common stockholders – diluted |
|
$ |
(0.07) |
|
$ |
(0.10) |
|
$ |
0.03 |
|
$ |
(0.13) |
Weighted average common shares outstanding – basic |
|
|
122,404,404 |
|
|
121,852,349 |
|
|
122,290,676 |
|
|
122,539,986 |
Weighted average common shares outstanding – diluted |
|
|
122,404,404 |
|
|
121,852,349 |
|
|
128,361,845 |
|
|
122,539,986 |
Condensed Consolidated Balance Sheets
(Unaudited) (Amounts in thousands, except par value per share and share amounts)
|
|
|
|
|
|
|
|
|
June 30, |
|
December 31, |
|
|
2026 |
|
2025 |
Assets |
|
|
|
|
|
|
Current assets: |
|
|
|
|
|
|
Cash and cash equivalents |
|
$ |
282,392 |
|
$ |
330,303 |
Short-term investments |
|
|
11,792 |
|
|
24,692 |
Accounts receivable, net |
|
|
38,836 |
|
|
34,776 |
Unbilled receivables, net |
|
|
21,291 |
|
|
20,522 |
Funds receivable from payment partners |
|
|
108,703 |
|
|
155,455 |
Prepaid expenses and other current assets |
|
|
41,458 |
|
|
36,540 |
Total current assets |
|
|
504,472 |
|
|
602,288 |
Property and equipment, net |
|
|
26,420 |
|
|
22,125 |
Intangible assets, net |
|
|
177,743 |
|
|
189,050 |
Goodwill |
|
|
407,025 |
|
|
406,507 |
Other assets |
|
|
47,326 |
|
|
33,343 |
Total assets |
|
$ |
1,162,986 |
|
$ |
1,253,313 |
Liabilities and Stockholders’ Equity |
|
|
|
|
|
|
Current liabilities: |
|
|
|
|
|
|
Accounts payable |
|
$ |
18,208 |
|
$ |
15,298 |
Funds payable to clients |
|
|
235,496 |
|
|
310,799 |
Accrued expenses and other current liabilities |
|
|
56,739 |
|
|
55,715 |
Deferred revenue |
|
|
20,474 |
|
|
19,951 |
Total current liabilities |
|
|
330,917 |
|
|
401,763 |
Deferred tax liabilities |
|
|
12,648 |
|
|
12,900 |
Other liabilities |
|
|
2,831 |
|
|
3,479 |
Total liabilities |
|
|
346,396 |
|
|
418,142 |
Commitments and contingencies |
|
|
|
|
|
|
Stockholders’ equity: |
|
|
|
|
|
|
Preferred stock, $0.0001 par value; 10,000,000 shares authorized, none issued and outstanding as of June 30, 2026 and December 31, 2025 |
|
|
— |
|
|
— |
Voting common stock, $0.0001 par value; 2,000,000,000 shares authorized, 133,968,610 shares issued and 121,609,147 shares outstanding as of June 30, 2026; 130,335,519 shares issued and 120,086,090 shares outstanding as of December 31, 2025 |
|
|
13 |
|
|
13 |
Non-voting common stock, $0.0001 par value; 10,000,000 shares authorized, none issued and outstanding as of June 30, 2026, and 1,873,320 shares issued and outstanding as of December 31, 2025, respectively |
|
|
— |
|
|
— |
Treasury voting common stock, at cost; 12,359,463 and 10,249,429 shares as of June 30, 2026 and December 31, 2025, respectively |
|
|
(177,411) |
|
|
(118,636) |
Additional paid-in capital |
|
|
1,142,573 |
|
|
1,108,679 |
Accumulated other comprehensive income |
|
|
4,417 |
|
|
2,488 |
Accumulated deficit |
|
|
(153,002) |
|
|
(157,373) |
Total stockholders’ equity |
|
|
816,590 |
|
|
835,171 |
Total liabilities and stockholders’ equity |
|
$ |
1,162,986 |
|
$ |
1,253,313 |
Condensed Consolidated Statements of Cash Flows
(Unaudited) (Amounts in thousands)
|
|
|
|
|
|
|
|
|
Six Months Ended June 30, |
|
|
2026 |
|
2025 |
Cash flows from operating activities: |
|
|
|
|
|
|
Net income (loss) |
|
$ |
4,371 |
|
$ |
(16,167) |
Adjustments to reconcile net income (loss) to net cash provided by (used in) operating activities: |
|
|
|
|
|
|
Unrealized gain from remeasurement of foreign currency |
|
|
(4,397) |
|
|
(9,747) |
Depreciation and amortization |
|
|
15,302 |
|
|
12,270 |
Stock-based compensation expense |
|
|
34,847 |
|
|
35,740 |
Amortization of deferred contract costs |
|
|
1,130 |
|
|
768 |
Change in fair value of contingent consideration |
|
|
1,727 |
|
|
(502) |
Deferred tax provision |
|
|
(2,387) |
|
|
1,003 |
Change in provision for uncollectible accounts |
|
|
607 |
|
|
252 |
Amortization of debt issuance costs |
|
|
197 |
|
|
92 |
Net accretion of discounts and amortization of premiums on investments |
|
|
(16) |
|
|
(595) |
Other |
|
|
— |
|
|
(166) |
Changes in operating assets and liabilities, net of acquisitions: |
|
|
|
|
|
|
Accounts receivable |
|
|
(4,709) |
|
|
94 |
Unbilled receivables |
|
|
(752) |
|
|
(1,518) |
Funds receivable from payment partners |
|
|
49,244 |
|
|
2,090 |
Prepaid expenses, other current assets and other assets |
|
|
(16,989) |
|
|
(16,247) |
Funds payable to clients |
|
|
(73,365) |
|
|
(62,572) |
Accounts payable, accrued expenses and other current liabilities |
|
|
736 |
|
|
(2,138) |
Other liabilities |
|
|
(793) |
|
|
(622) |
Deferred revenue |
|
|
501 |
|
|
(2,914) |
Net cash provided by (used in) operating activities |
|
|
5,254 |
|
|
(60,879) |
Cash flows from investing activities: |
|
|
|
|
|
|
Acquisitions of businesses, net of cash acquired |
|
|
— |
|
|
(319,835) |
Purchase of short-term and long-term investments |
|
|
— |
|
|
(14,802) |
Proceeds from the maturity and sale of short-term and long-term investments |
|
|
12,707 |
|
|
142,334 |
Capitalization of internally developed software |
|
|
(6,492) |
|
|
(3,392) |
Purchases of property and equipment |
|
|
(412) |
|
|
(734) |
Net cash provided by (used in) investing activities |
|
|
5,803 |
|
|
(196,429) |
Cash flows from financing activities: |
|
|
|
|
|
|
Proceeds from issuance of revolving credit facility |
|
|
— |
|
|
125,000 |
Payment of revolving credit facility |
|
|
— |
|
|
(65,000) |
Contingent consideration paid for acquisitions |
|
|
— |
|
|
(2,710) |
Payments of tax withholdings for net settled equity awards |
|
|
(5,351) |
|
|
(2,364) |
Common stock repurchased including related costs |
|
|
(30,523) |
|
|
(54,304) |
Non-voting common stock repurchased and retired |
|
|
(29,036) |
|
|
— |
Proceeds from the issuance of stock under Employee Stock Purchase Plan |
|
|
1,592 |
|
|
1,242 |
Proceeds from exercise of stock options |
|
|
2,157 |
|
|
1,753 |
Net cash (used in) provided by financing activities |
|
|
(61,161) |
|
|
3,617 |
Effect of exchange rates changes on cash and cash equivalents |
|
|
2,193 |
|
|
8,135 |
Net change in cash and cash equivalents |
|
|
(47,911) |
|
|
(245,556) |
Cash and cash equivalents, beginning of period |
|
|
330,303 |
|
|
495,242 |
Cash and cash equivalents, end of period |
|
$ |
282,392 |
|
$ |
249,686 |
* We have revised the six months ended June 30, 2025, Condensed Consolidated Statements of Cash Flows to correct
classification errors identified and previously disclosed in our Form 10-Q during the nine month ended September 30, 2025.
Reconciliation of Non-GAAP Financial Measures
(Unaudited) (Amounts in millions, except percentages)
All dollar amounts in the tables below are rounded and as a result, certain amounts may not recalculate using the rounded amounts provided.
Revenue Less Ancillary Services, Adjusted Gross Profit, and Adjusted Gross Margin
|
|
|
|
|
|
|
|
|
|
|
|
|
|
|
Three Months Ended June 30, |
|
Six Months Ended June 30, |
(dollars in millions) |
|
2026 |
|
2025 |
|
2026 |
|
2025 |
Revenue |
|
$ |
167.7 |
|
$ |
131.9 |
|
$ |
355.9 |
|
$ |
265.3 |
Adjusted to exclude gross up for: |
|
|
|
|
|
|
|
|
|
|
|
|
Pass-through cost for printing and mailing |
|
|
(3.9) |
|
|
(4.2) |
|
|
(7.9) |
|
|
(8.7) |
Marketing fees |
|
|
— |
|
|
(0.1) |
|
|
(0.1) |
|
|
(0.5) |
Revenue Less Ancillary Services |
|
$ |
163.8 |
|
$ |
127.5 |
|
$ |
347.8 |
|
$ |
256.2 |
Payment processing services costs |
|
|
74.7 |
|
|
53.9 |
|
|
152.2 |
|
|
104.5 |
Hosting and amortization costs within technology and development expenses |
|
|
3.4 |
|
|
2.9 |
|
|
7.3 |
|
|
5.3 |
Cost of Revenue |
|
$ |
78.2 |
|
$ |
56.7 |
|
$ |
159.5 |
|
$ |
109.8 |
Adjusted to: |
|
|
|
|
|
|
|
|
|
|
|
|
Exclude printing and mailing costs |
|
|
(3.9) |
|
|
(4.2) |
|
|
(7.9) |
|
|
(8.7) |
Offset marketing fees against related costs |
|
|
— |
|
|
(0.1) |
|
|
(0.1) |
|
|
(0.5) |
Exclude depreciation and amortization |
|
|
(3.1) |
|
|
(2.7) |
|
|
(6.9) |
|
|
(4.8) |
Adjusted Cost of Revenue |
|
$ |
71.1 |
|
$ |
49.7 |
|
$ |
144.6 |
|
$ |
95.8 |
Gross Profit |
|
$ |
89.6 |
|
$ |
75.1 |
|
$ |
196.4 |
|
$ |
155.6 |
Gross Margin |
|
|
53.4% |
|
|
57.0% |
|
|
55.2% |
|
|
58.7% |
Adjusted Gross Profit |
|
$ |
92.7 |
|
$ |
77.9 |
|
$ |
203.2 |
|
$ |
160.4 |
Adjusted Gross Margin |
|
|
56.6% |
|
|
61.1% |
|
|
58.4% |
|
|
62.6% |
Revenue Less Ancillary Services Disaggregated by Revenue Type
|
|
|
|
|
|
|
|
|
|
|
|
|
|
|
|
|
|
|
|
|
Three Months Ended June 30, 2026 |
|
Three Months Ended June 30, 2025 |
(dollars in millions) |
|
Transaction |
|
Platform and other revenues |
|
Revenue |
|
Transaction |
|
Platform and other revenues |
|
Revenue |
Revenue |
|
$ |
135.9 |
|
$ |
31.8 |
|
$ |
167.7 |
|
$ |
100.6 |
|
$ |
31.3 |
|
$ |
131.9 |
Adjusted to exclude gross up for: |
|
|
|
|
|
|
|
|
|
|
|
|
|
|
|
|
|
|
Pass-through cost for printing and mailing |
|
|
— |
|
|
(3.9) |
|
|
(3.9) |
|
|
— |
|
|
(4.2) |
|
|
(4.2) |
Marketing fees |
|
|
— |
|
|
— |
|
|
— |
|
|
(0.1) |
|
|
— |
|
|
(0.1) |
Revenue Less Ancillary Services |
|
$ |
135.9 |
|
$ |
28.0 |
|
$ |
163.8 |
|
$ |
100.5 |
|
$ |
27.1 |
|
$ |
127.5 |
Percentage of Revenue |
|
|
81.0% |
|
|
19.0% |
|
|
100.0% |
|
|
76.3% |
|
|
23.7% |
|
|
100.0% |
Percentage of Revenue Less Ancillary Services |
|
|
82.9% |
|
|
17.1% |
|
|
100.0% |
|
|
78.8% |
|
|
21.2% |
|
|
100.0% |
|
|
|
|
|
|
|
|
|
|
|
|
|
|
|
|
|
|
|
|
|
Six Months Ended June 30, 2026 |
|
Six Months Ended June 30, 2025 |
(dollars in millions) |
|
Transaction |
|
Platform and other revenues |
|
Revenue |
|
Transaction |
|
Platform and other revenues |
|
Revenue |
Revenue |
|
$ |
291.1 |
|
$ |
64.8 |
|
$ |
355.9 |
|
$ |
209.1 |
|
$ |
56.3 |
|
$ |
265.3 |
Adjusted to exclude gross up for: |
|
|
|
|
|
|
|
|
|
|
|
|
|
|
|
|
|
|
Pass-through cost for printing and mailing |
|
|
— |
|
|
(7.9) |
|
|
(7.9) |
|
|
— |
|
|
(8.7) |
|
|
(8.7) |
Marketing fees |
|
|
(0.1) |
|
|
— |
|
|
(0.1) |
|
|
(0.5) |
|
|
— |
|
|
(0.5) |
Revenue Less Ancillary Services |
|
$ |
291.0 |
|
$ |
56.8 |
|
$ |
347.8 |
|
$ |
208.6 |
|
$ |
47.6 |
|
$ |
256.2 |
Percentage of Revenue |
|
|
81.8% |
|
|
18.2% |
|
|
100.0% |
|
|
78.8% |
|
|
21.2% |
|
|
100.0% |
Percentage of Revenue Less Ancillary Services |
|
|
83.7% |
|
|
16.3% |
|
|
100.0% |
|
|
81.4% |
|
|
18.6% |
|
|
100.0% |
FX Neutral Revenue Less Ancillary Services
|
|
|
|
|
|
|
|
|
|
|
|
|
|
|
|
|
|
|
|
|
Three Months Ended June 30, |
|
Growth |
|
Six Months Ended June 30, |
|
Growth |
(dollars in millions) |
|
2026 |
|
2025 |
|
Rate |
|
2026 |
|
2025 |
|
Rate |
Revenue |
|
$ |
167.7 |
|
$ |
131.9 |
|
|
27.2% |
|
$ |
355.9 |
|
$ |
265.3 |
|
|
34.1% |
Ancillary services |
|
|
(3.9) |
|
|
(4.3) |
|
|
|
|
|
(8.1) |
|
|
(9.2) |
|
|
|
Revenue Less Ancillary Services |
|
|
163.8 |
|
|
127.5 |
|
|
28.5% |
|
|
347.8 |
|
|
256.2 |
|
|
35.7% |
Effects of foreign currency rate fluctuations |
|
|
(2.0) |
|
|
— |
|
|
|
|
|
(9.4) |
|
|
— |
|
|
|
FX Neutral Revenue Less Ancillary Services |
|
$ |
161.8 |
|
$ |
127.5 |
|
|
26.9% |
|
$ |
338.4 |
|
$ |
256.2 |
|
|
32.1% |
Reconciliation of GAAP Operating Expenses to Non-GAAP Operating Expenses
|
|
|
|
|
|
|
|
|
|
|
|
|
|
|
Three Months Ended June 30, |
|
Six Months Ended June 30, |
(dollars in millions) |
|
2026 |
|
2025 |
|
2026 |
|
2025 |
GAAP Technology and development |
|
$ |
18.4 |
|
$ |
17.1 |
|
$ |
37.8 |
|
$ |
34.0 |
(-) Stock-based compensation expense and related taxes |
|
|
(2.5) |
|
|
(3.2) |
|
|
(5.8) |
|
|
(6.4) |
(-) Depreciation and amortization |
|
|
(1.6) |
|
|
(1.6) |
|
|
(3.4) |
|
|
(3.3) |
Non-GAAP Technology and development |
|
$ |
14.2 |
|
$ |
12.3 |
|
$ |
28.6 |
|
$ |
24.3 |
|
|
|
|
|
|
|
|
|
|
|
|
|
GAAP Selling and marketing |
|
$ |
38.9 |
|
$ |
38.4 |
|
$ |
79.4 |
|
$ |
74.9 |
(-) Stock-based compensation expense and related taxes |
|
|
(6.0) |
|
|
(4.9) |
|
|
(11.1) |
|
|
(9.2) |
(-) Depreciation and amortization |
|
|
(4.5) |
|
|
(4.3) |
|
|
(9.8) |
|
|
(7.3) |
Non-GAAP Selling and marketing |
|
$ |
28.5 |
|
$ |
29.2 |
|
$ |
58.6 |
|
$ |
58.4 |
|
|
|
|
|
|
|
|
|
|
|
|
|
GAAP General and administrative |
|
$ |
38.5 |
|
$ |
30.2 |
|
$ |
78.4 |
|
$ |
63.2 |
(-) Stock-based compensation expense and related taxes |
|
|
(9.2) |
|
|
(9.3) |
|
|
(18.6) |
|
|
(17.7) |
(-) Depreciation and amortization |
|
|
(1.0) |
|
|
(0.8) |
|
|
(2.0) |
|
|
(1.6) |
(-) Change in fair value of contingent consideration |
|
|
(0.5) |
|
|
0.7 |
|
|
(1.7) |
|
|
0.5 |
(-) Acquisition related transaction costs |
|
|
— |
|
|
(0.1) |
|
|
— |
|
|
(2.5) |
Non-GAAP General and administrative |
|
$ |
27.7 |
|
$ |
20.7 |
|
$ |
56.0 |
|
$ |
41.9 |
EBITDA, Adjusted EBITDA, and Adjusted EBITDA Margin
|
|
|
|
|
|
|
|
|
|
|
|
|
|
|
Three Months Ended June 30, |
|
Six Months Ended June 30, |
(dollars in millions) |
|
2026 |
|
2025 |
|
2026 |
|
2025 |
Net (loss) income |
|
$ |
(8.1) |
|
$ |
(12.0) |
|
$ |
4.4 |
|
$ |
(16.2) |
Interest expense |
|
|
0.3 |
|
|
1.0 |
|
|
0.6 |
|
|
1.8 |
Interest income |
|
|
(0.7) |
|
|
(1.1) |
|
|
(1.6) |
|
|
(4.0) |
Provision for income taxes |
|
|
2.8 |
|
|
7.0 |
|
|
5.0 |
|
|
6.1 |
Depreciation and amortization expense |
|
|
7.9 |
|
|
7.2 |
|
|
16.5 |
|
|
13.0 |
EBITDA |
|
|
2.2 |
|
|
2.1 |
|
|
24.9 |
|
|
0.7 |
Stock-based compensation expense and related taxes |
|
|
17.8 |
|
|
17.3 |
|
|
35.5 |
|
|
33.3 |
Change in fair value of contingent consideration |
|
|
0.5 |
|
|
(0.7) |
|
|
1.7 |
|
|
(0.5) |
Loss (gain) from remeasurement of foreign currency |
|
|
2.9 |
|
|
(3.9) |
|
|
(0.4) |
|
|
(7.5) |
Gain on available-for-sale debt securities |
|
|
— |
|
|
— |
|
|
— |
|
|
(0.2) |
Indirect taxes related to intercompany activity |
|
|
0.6 |
|
|
0.4 |
|
|
1.5 |
|
|
1.0 |
Acquisition-related transaction costs |
|
|
— |
|
|
0.1 |
|
|
— |
|
|
2.5 |
Restructuring |
|
|
— |
|
|
1.4 |
|
|
— |
|
|
8.7 |
Adjusted EBITDA |
|
$ |
24.0 |
|
$ |
16.6 |
|
$ |
63.3 |
|
$ |
38.0 |
Adjusted EBITDA margin |
|
|
14.6% |
|
|
13.0% |
|
|
18.2% |
|
|
14.8% |
Q2 2026 Earnings Supplement�August 4, 2026 Exhibit 99.2
Disclosures This presentation includes forward-looking statements within the meaning of the Private Securities Litigation Reform Act of 1995 and Section 21E of the Securities Exchange Act of 1934, as amended. All statements other than statements of historical facts contained in this presentation, including statements regarding the outcome of the operational and portfolio reviews, the costs, cash outlays, benefits, timing and financial impacts of the actions that may be taken or transactions entered into in connection with the operational and portfolio reviews, Flywire’s ability to successfully implement Flywire’s business plan, future results of operations and financial position, business strategy and plans, market growth and Flywire’s objectives for future operations, are forward -looking statements. The words “believe,” “may,” “will,” “estimate,” “continue,” “anticipate,” “intend,” “expect,” “plans,” “potential,” “seeks,” “projects,” “should,” “could” and “would” and similar expressions are intended to identify forward -looking statements, although not all forward-looking statements contain these identifying words. Flywire has based these forward-looking statements largely on Flywire’s current expectations and projections about future events and financial trends that Flywire believes may affect Flywire’s financial condition, results of operations, business strategy, short-term and long-term business operations and objectives, and financial needs. These forward-looking statements are subject to a number of risks, uncertainties and assumptions that are described in the "Risk Factors" and "Management's Discussion and Analysis of Financial Condition and Results of Operations" sections of Flywire's Annual Report on Form 10-K for the year ended December 31, 2025 and Quarterly Report on Form 10-Q for the end quarter ended March 31, 2026, which are on file with the Securities and Exchange Commission (SEC) and available on the SEC’s website at www.sec.gov. Additional factors may be described in those sections of Flywire’s Quarterly Report on Form 10-Q for the quarter ended June 30, 2026, expected to be filed with the SEC in the third quarter of 2026. In light of these risks, uncertainties and assumptions, the forward -looking events and circumstances discussed in this presentation may not occur and actual results could differ materially and adversely from those anticipated or implied in the forward-looking statements. You should not rely upon forward-looking statements as predictions of future events or performance.��In addition, projections, assumptions and estimates of the future performance of the industries in which Flywire operates and the markets it serves are inherently imprecise and subject to a high degree of uncertainty and risk. All financial projections contained in this presentation are forward -looking statements and are based on Flywire’s management’s assessment of such matters. It is unlikely, however, that the assumptions on which Flywire has based its projections will prove to be fully correct or that the projected figures will be attained. Flywire’s actual future results may differ materially from Flywire’s projections, and it makes no express or implied representation or warranty as to attainability of the results reflected in these projections. Investments in Flywire’s securities involve a high degree of risk and should be regarded as speculative.��The information in this presentation is provided only as of August 4, 2026, and Flywire undertakes no obligation to update any forward-looking statements contained in this presentation on account of new information, future events, or otherwise, except as required by law. This presentation contains certain non-GAAP financial measures as defined by SEC rules. Flywire has provided a reconciliation of those measures to the most directly comparable GAAP measures, which is available in the Appendix. The company has not provided a quantitative reconciliation of forecasted FX-Neutral Revenue Less Ancillary Services Growth to forecasted GAAP Revenue Growth or forecasted Adjusted EBITDA Margin Growth to forecasted GAAP Net Income Margin Growth or to forecasted GAAP net income (loss) before income taxes within this presentation because Flywire is unable, without making unreasonable efforts, to calculate certain reconciling items with confidence. These items include but are not limited to income taxes which are directly impacted by unpredictable fluctuations in the market price of the company's stock and in foreign exchange rates.
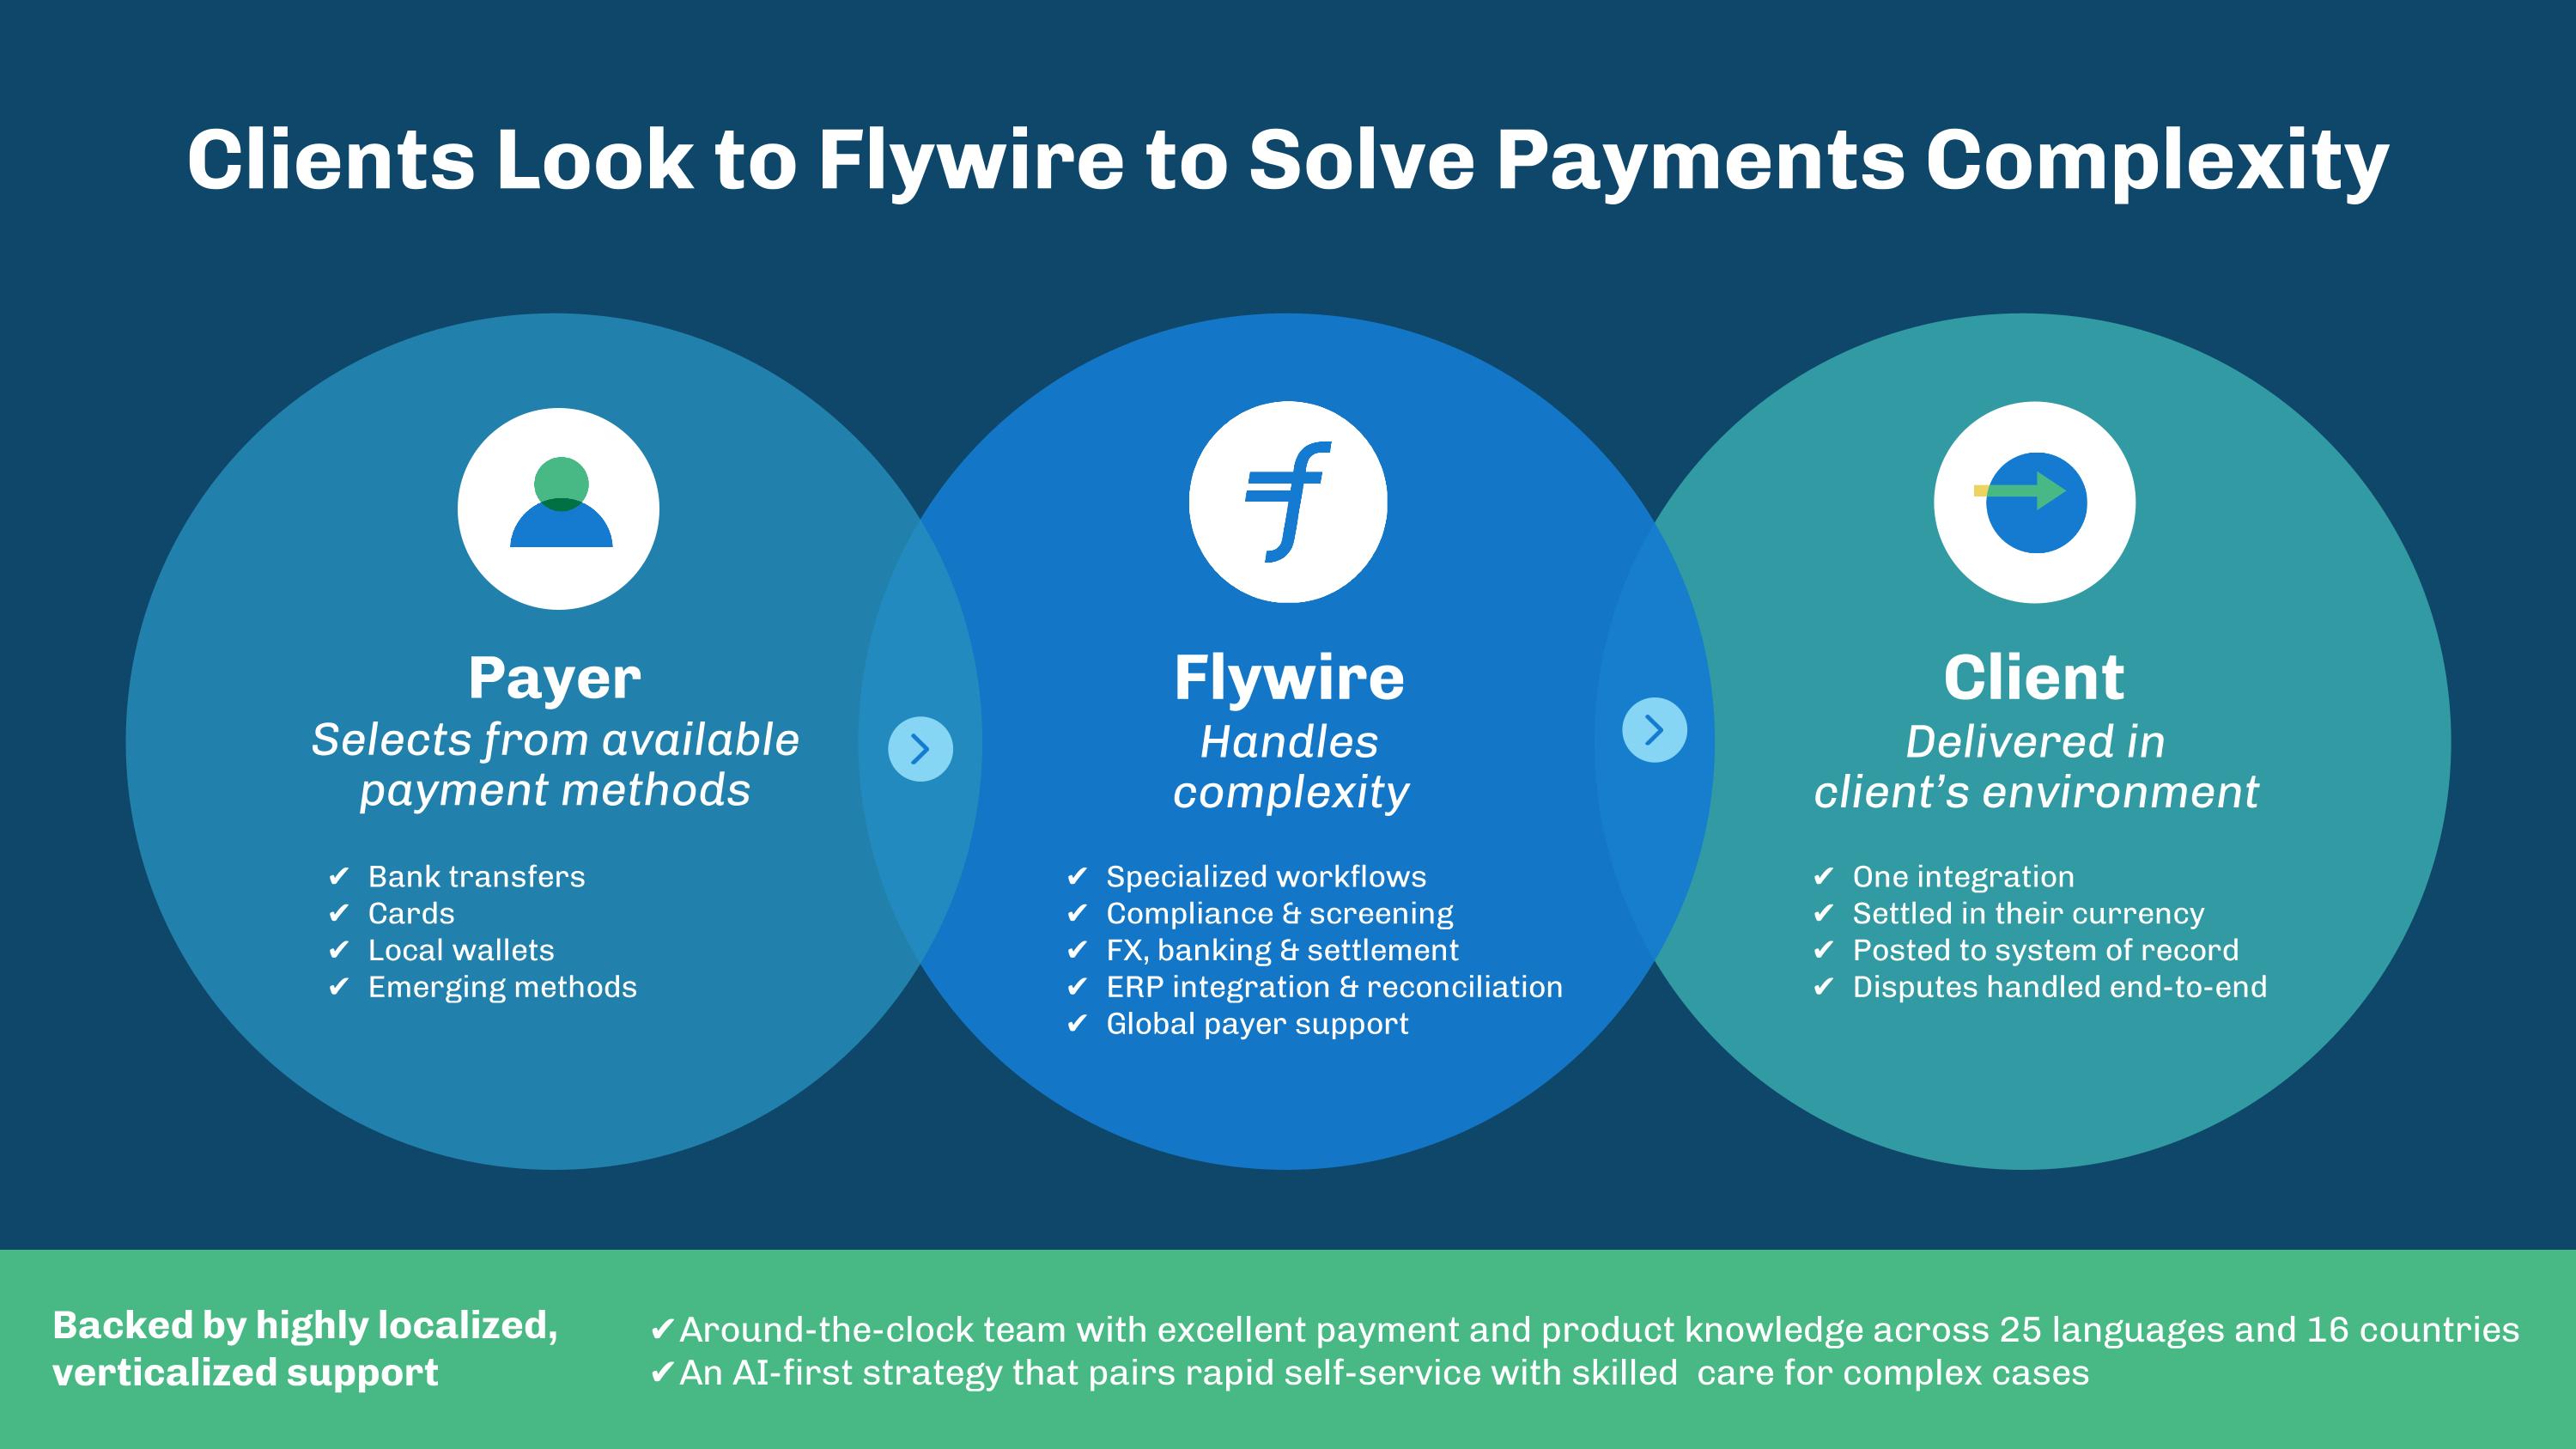
Backed by highly localized, verticalized support Clients Look to Flywire to Solve Payments Complexity Client�Delivered in�client’s environment One integration Settled in their currency Posted to system of record Disputes handled end-to-end Around-the-clock team with excellent payment and product knowledge across 25 languages and 16 countries An AI-first strategy that pairs rapid self-service with skilled care for complex cases Flywire Handles�complexity Specialized workflows Compliance & screening FX, banking & settlement ERP integration & reconciliation Global payer support Payer�Selects from available payment methods Bank transfers Cards Local wallets Emerging methods
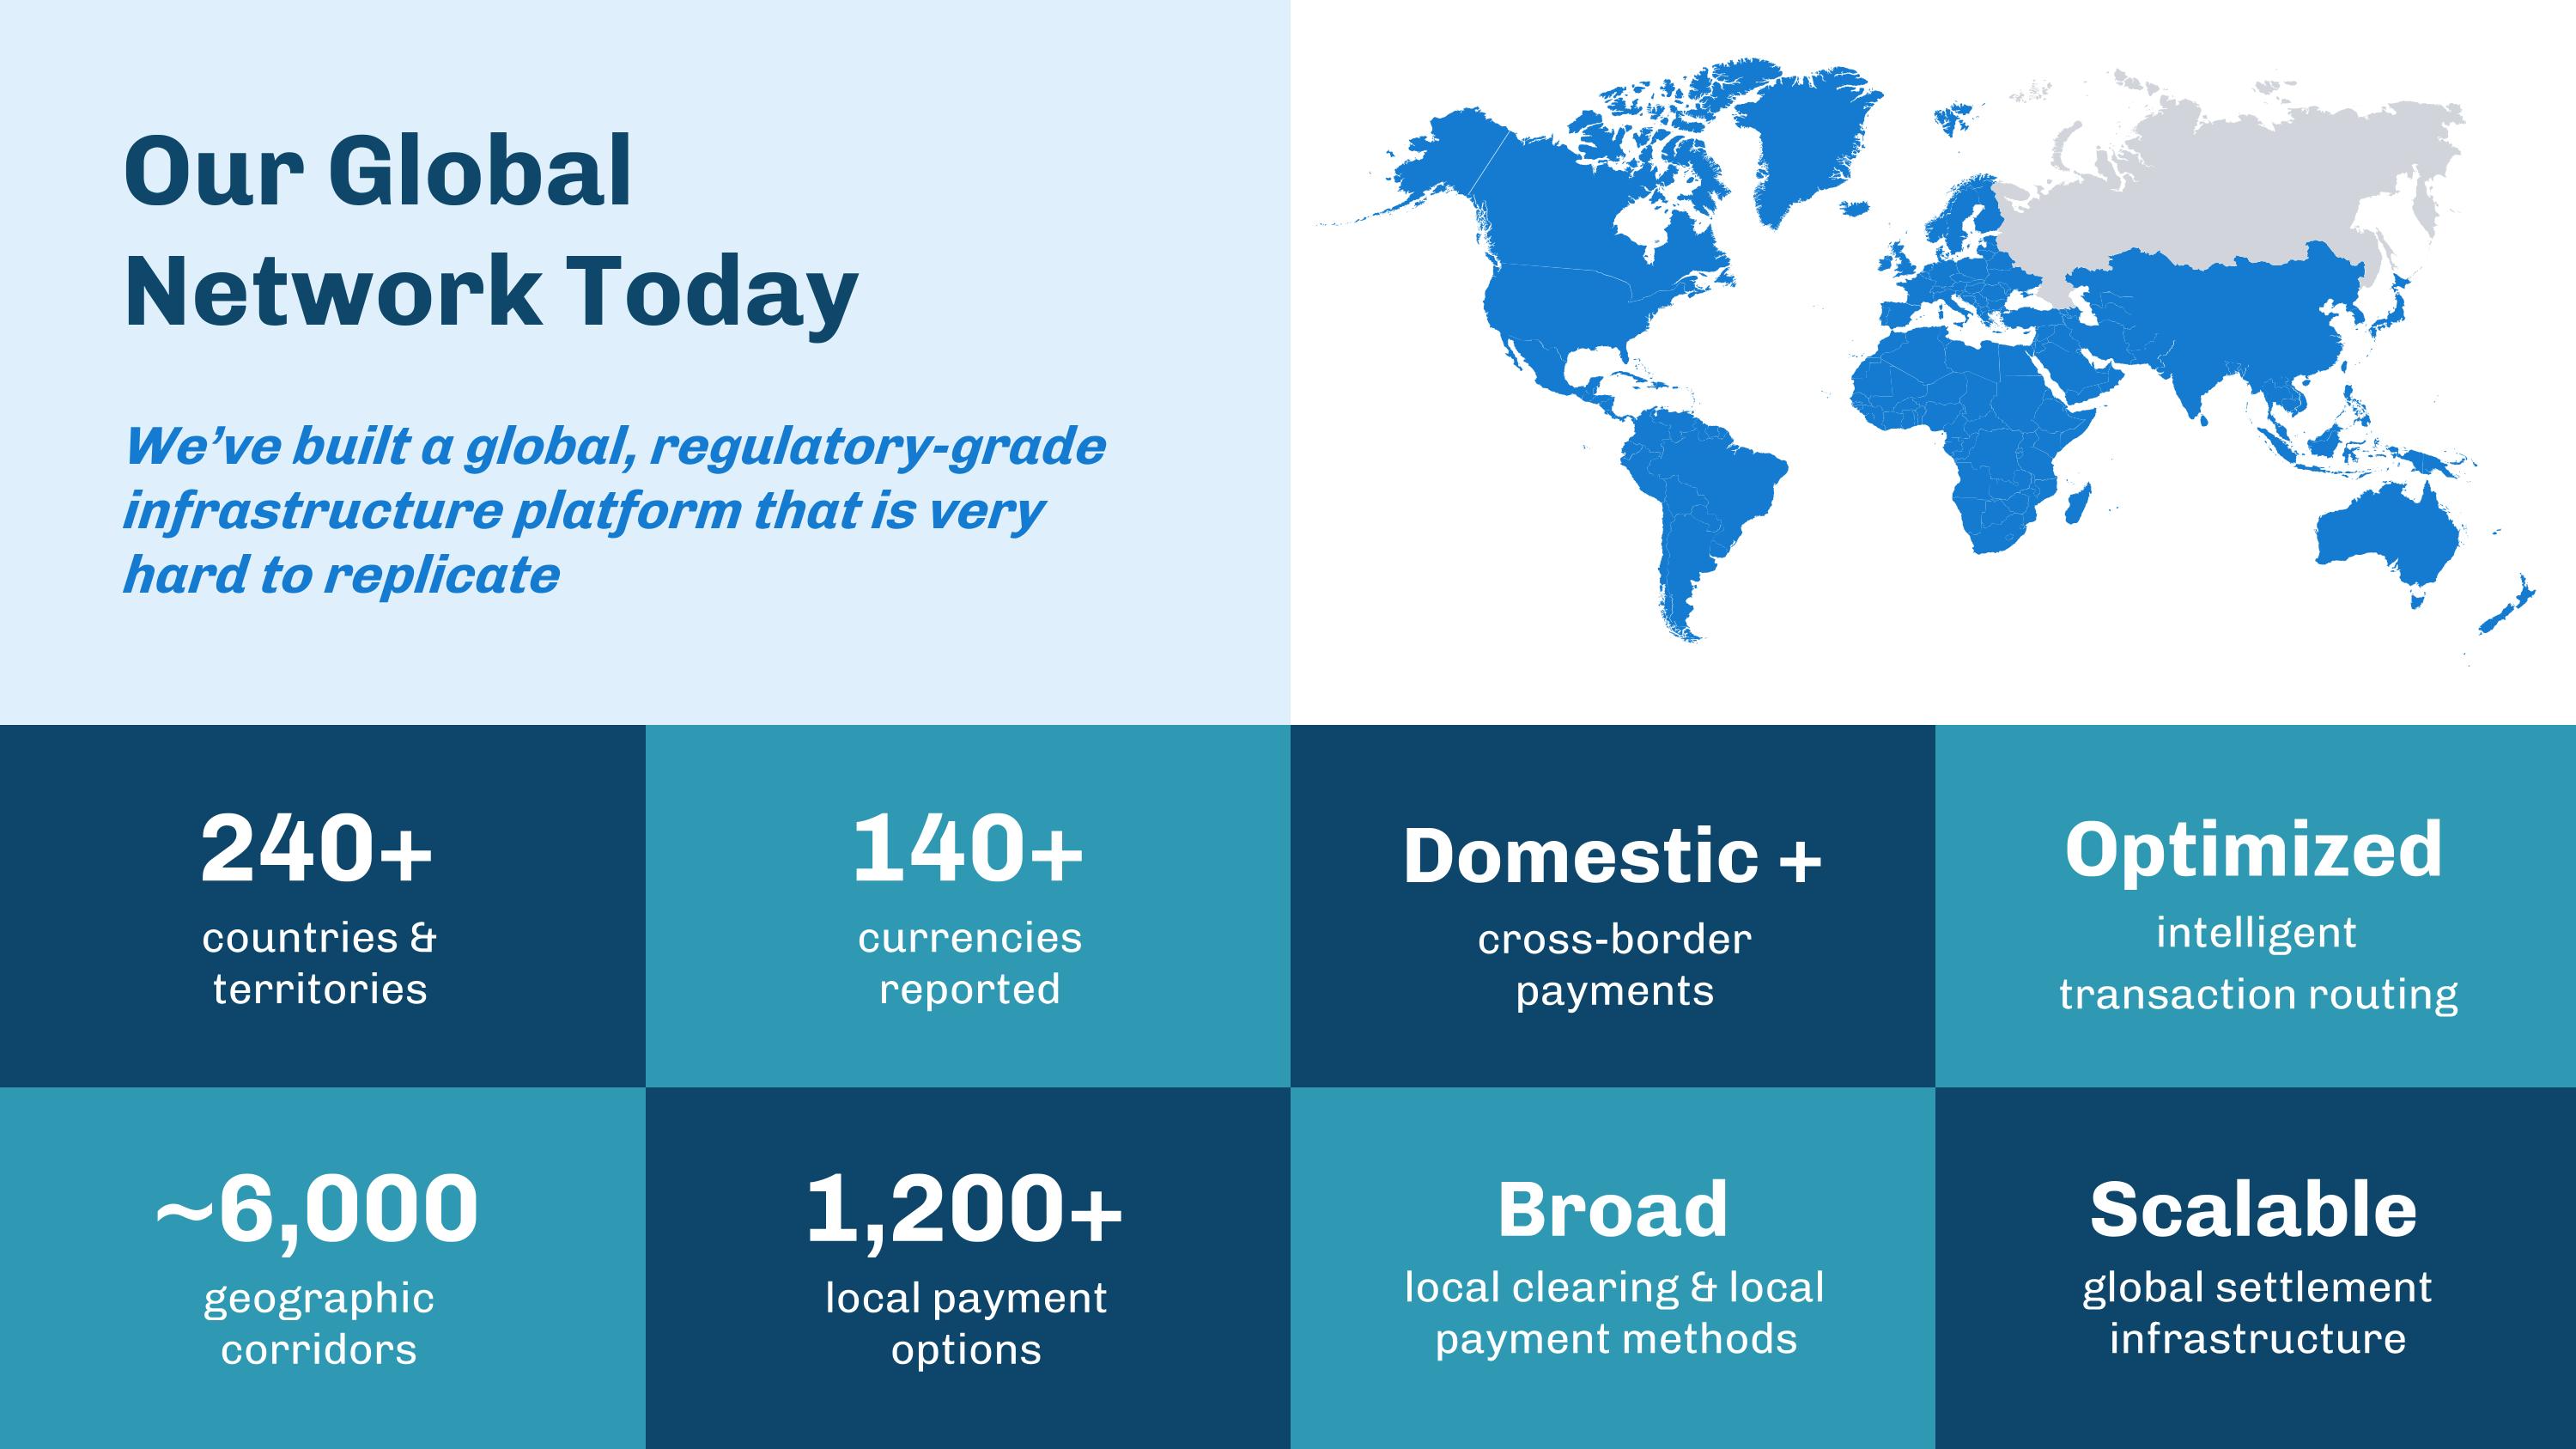
240+ countries & territories 1,200+ local payment options 140+ currencies�reported Optimized �intelligent�transaction routing ~6,000 geographic corridors Domestic + �cross-border�payments Scalable global settlement infrastructure Broad local clearing & local payment methods Our Global�Network Today We’ve built a global, regulatory-grade infrastructure platform that is very hard to replicate
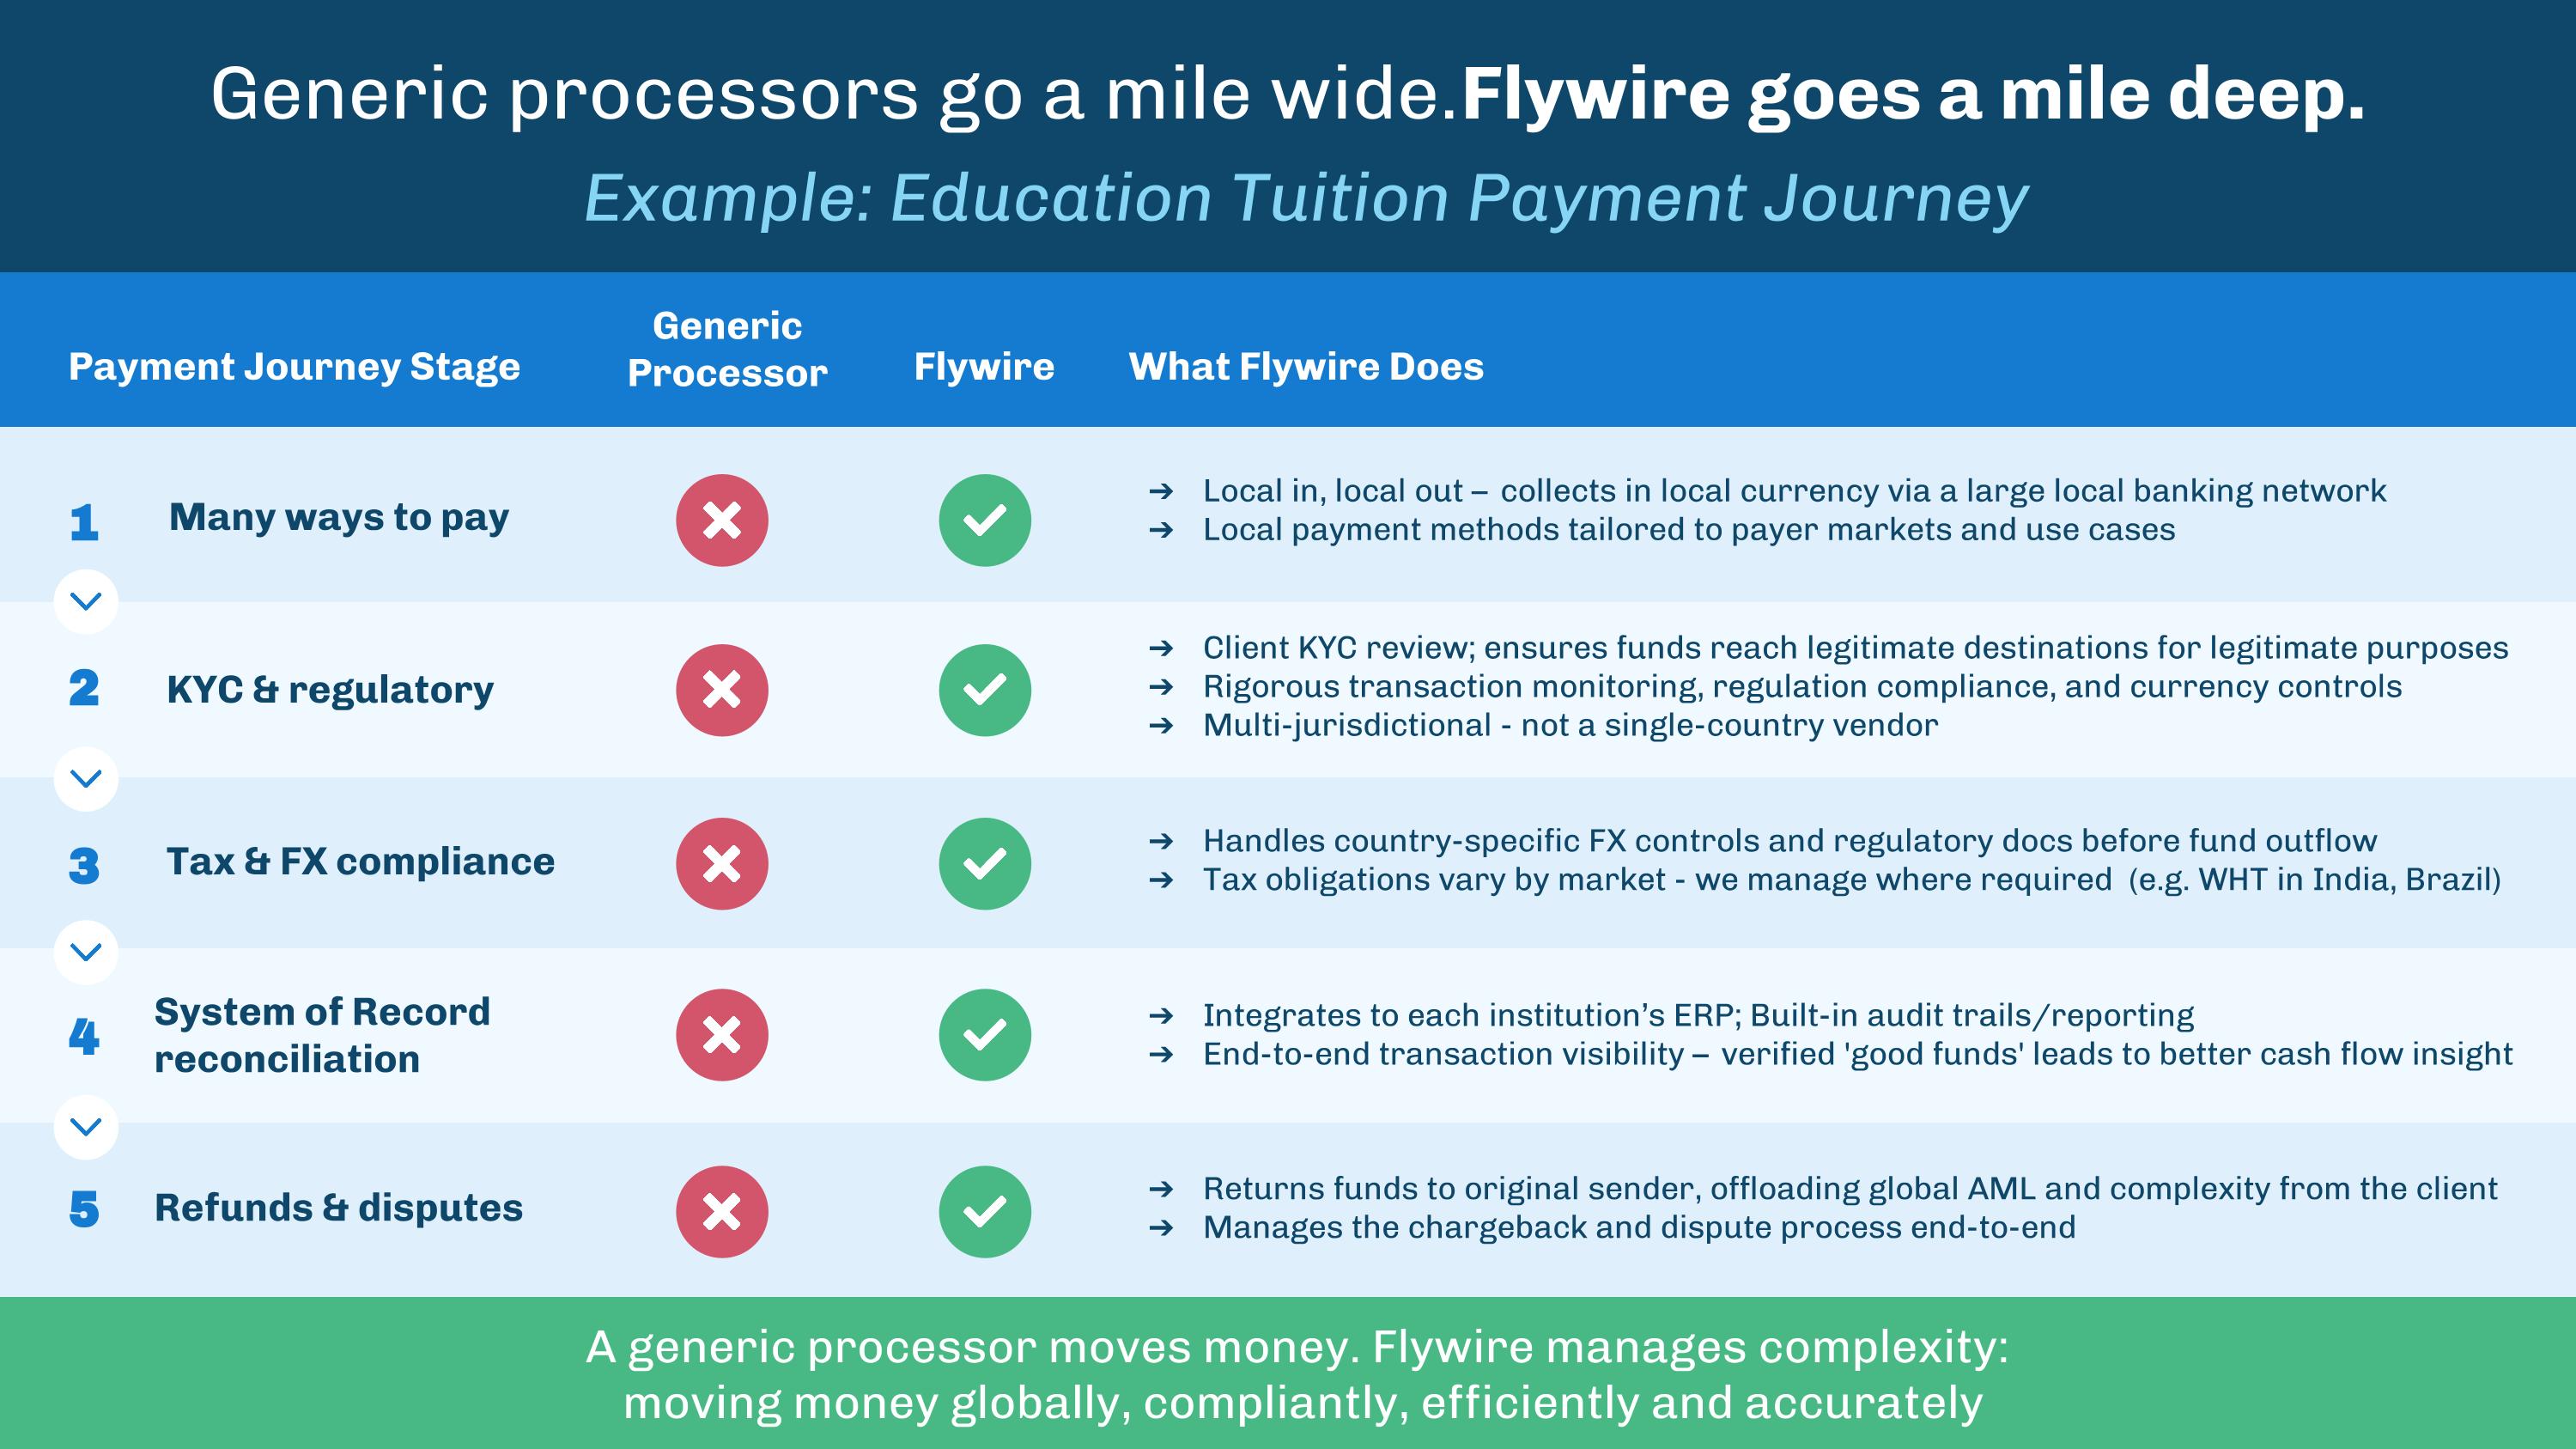
Generic processors go a mile wide. Flywire goes a mile deep. Generic Processor Flywire What Flywire Does Tax & FX compliance Handles country-specific FX controls and regulatory docs before fund outflow Tax obligations vary by market - we manage where required (e.g. WHT in India, Brazil) KYC & regulatory System of Record reconciliation Integrates to each institution’s ERP; Built-in audit trails/reporting End-to-end transaction visibility – verified 'good funds' leads to better cash flow insight Payment Journey Stage Example: Education Tuition Payment Journey Local in, local out – collects in local currency via a large local banking network Local payment methods tailored to payer markets and use cases Many ways to pay Client KYC review; ensures funds reach legitimate destinations for legitimate purposes Rigorous transaction monitoring, regulation compliance, and currency controls Multi-jurisdictional - not a single-country vendor 1 2 3 4 Refunds & disputes Returns funds to original sender, offloading global AML and complexity from the client Manages the chargeback and dispute process end-to-end 5 A generic processor moves money. Flywire manages complexity: moving money globally, compliantly, efficiently and accurately
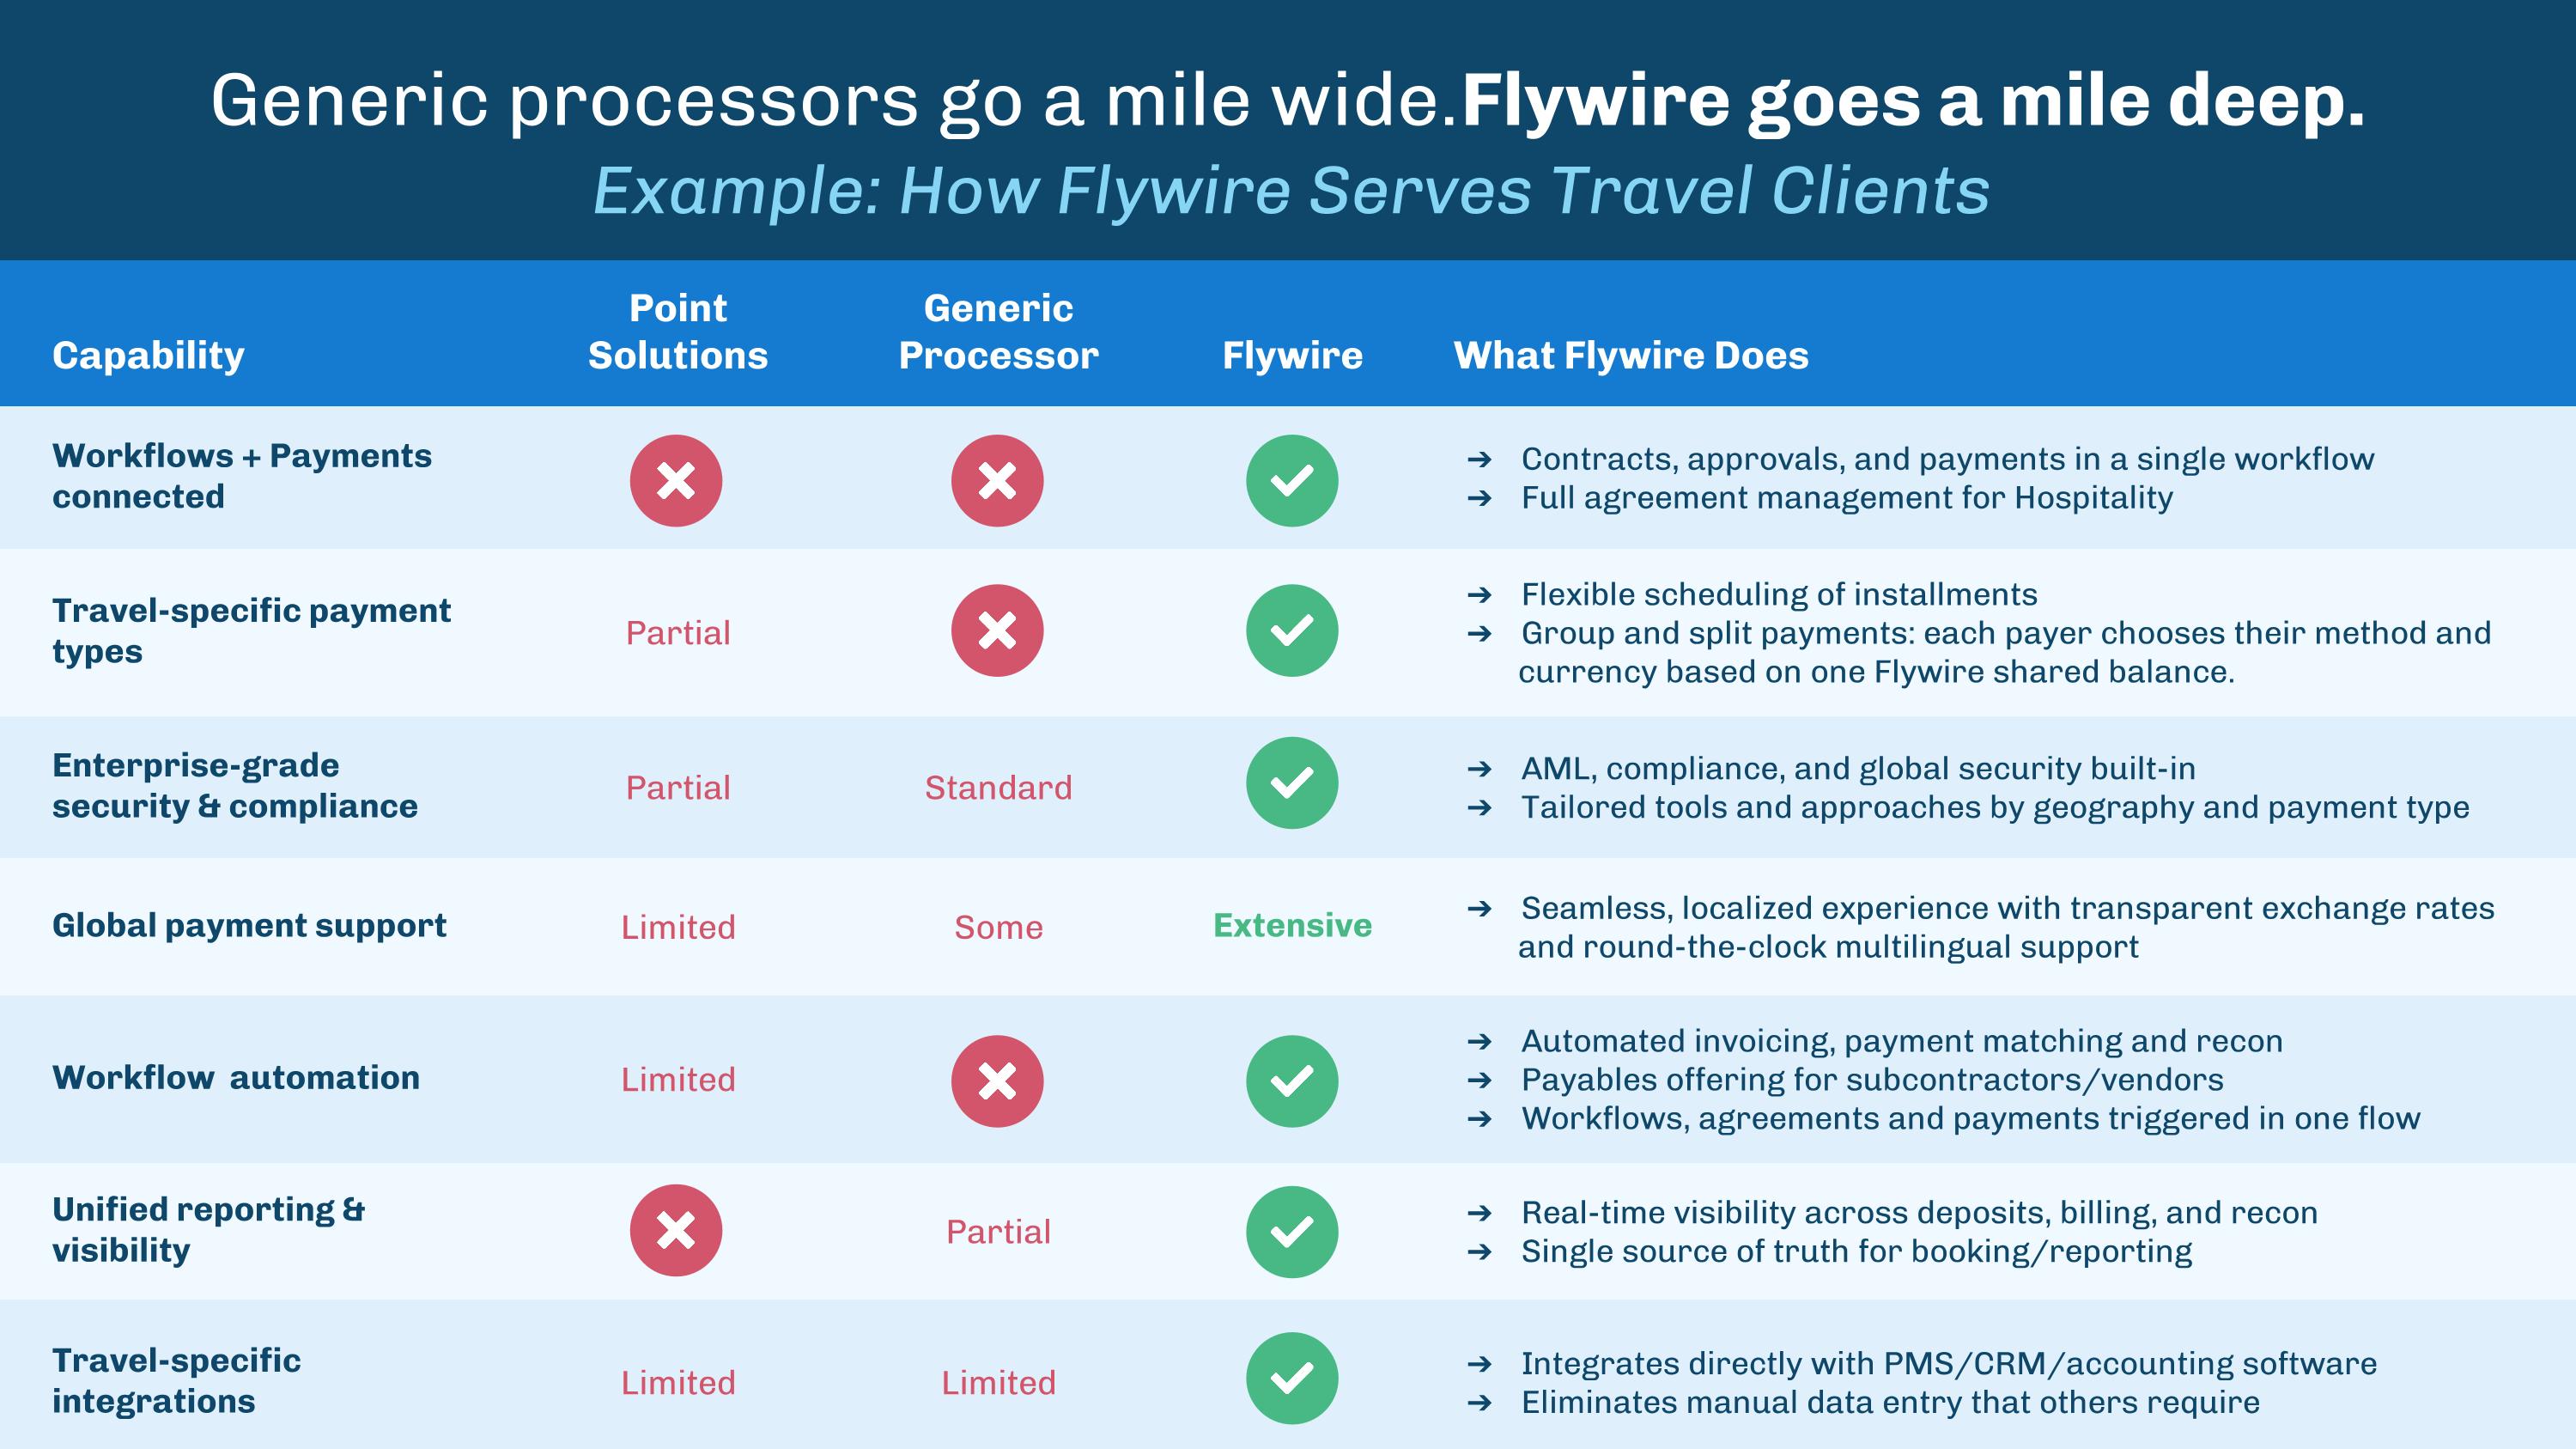
Capability Point Solutions Generic Processor Flywire What Flywire Does Workflows + Payments connected Contracts, approvals, and payments in a single workflow Full agreement management for Hospitality Travel-specific payment types Partial Flexible scheduling of installments Group and split payments: each payer chooses their method and currency based on one Flywire shared balance. Enterprise-grade security & compliance Partial Standard AML, compliance, and global security built-in Tailored tools and approaches by geography and payment type Global payment support Limited Some Extensive Seamless, localized experience with transparent exchange rates and round-the-clock multilingual support Workflow automation Limited Automated invoicing, payment matching and recon Payables offering for subcontractors/vendors Workflows, agreements and payments triggered in one flow Unified reporting & visibility Partial Real-time visibility across deposits, billing, and recon Single source of truth for booking/reporting Travel-specific integrations Limited Limited Integrates directly with PMS/CRM/accounting software Eliminates manual data entry that others require Generic processors go a mile wide. Flywire goes a mile deep. Example: How Flywire Serves Travel Clients
Spotlight: SFS Delivering Measurable Impact
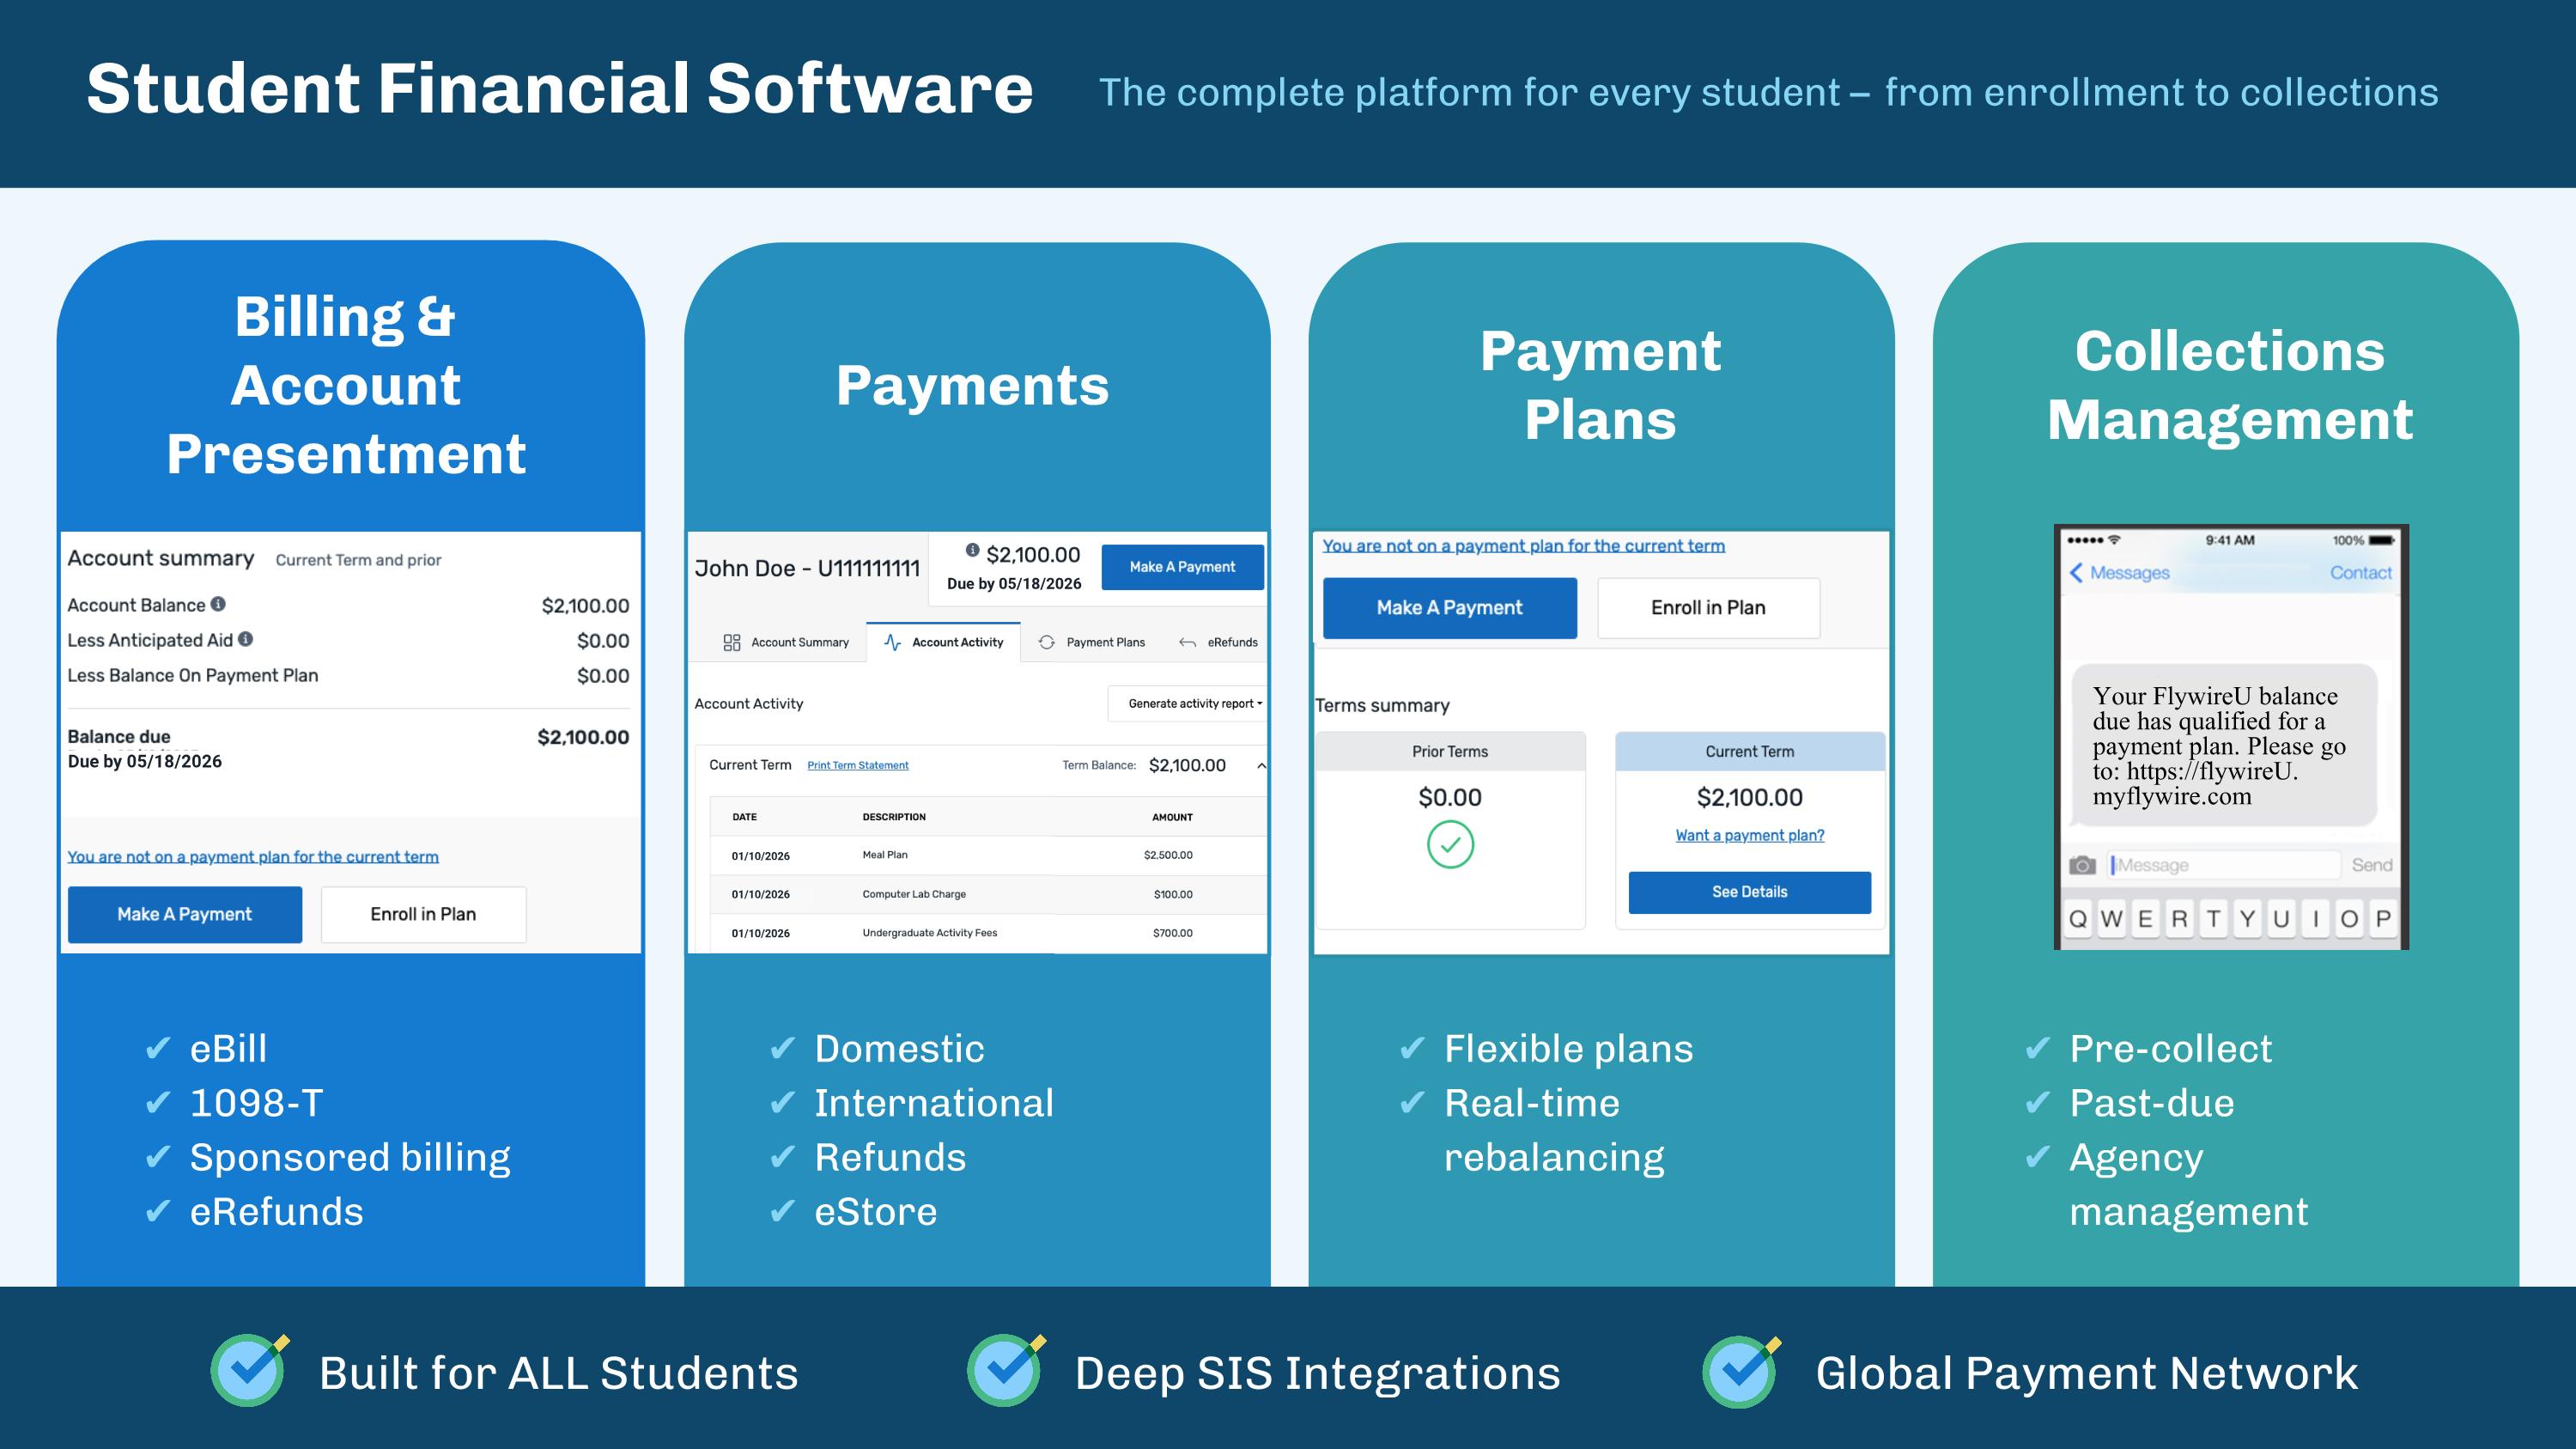
Due by 05/31/2026 Student Financial Software Billing &�Account Presentment eBill 1098-T Sponsored billing eRefunds The complete platform for every student – from enrollment to collections Payments Domestic International Refunds eStore Payment�Plans Collections Management Flexible plans Real-time rebalancing Pre-collect Past-due Agency management Your Flywire University balance due has qualified for a payment plan. Please go to: https://flywireU.. myflywire.com Your FlywireU balance due has qualified for a payment plan. Please go to: https://flywireU.�myflywire.com Due by 05/31/2026 01/31/2026 01/31/2026 01/31/2026 Due by 05/18/2026 Due by 05/18/2026 01/10/2026 01/10/2026 01/10/2026 Built for ALL Students Deep SIS Integrations Global Payment Network
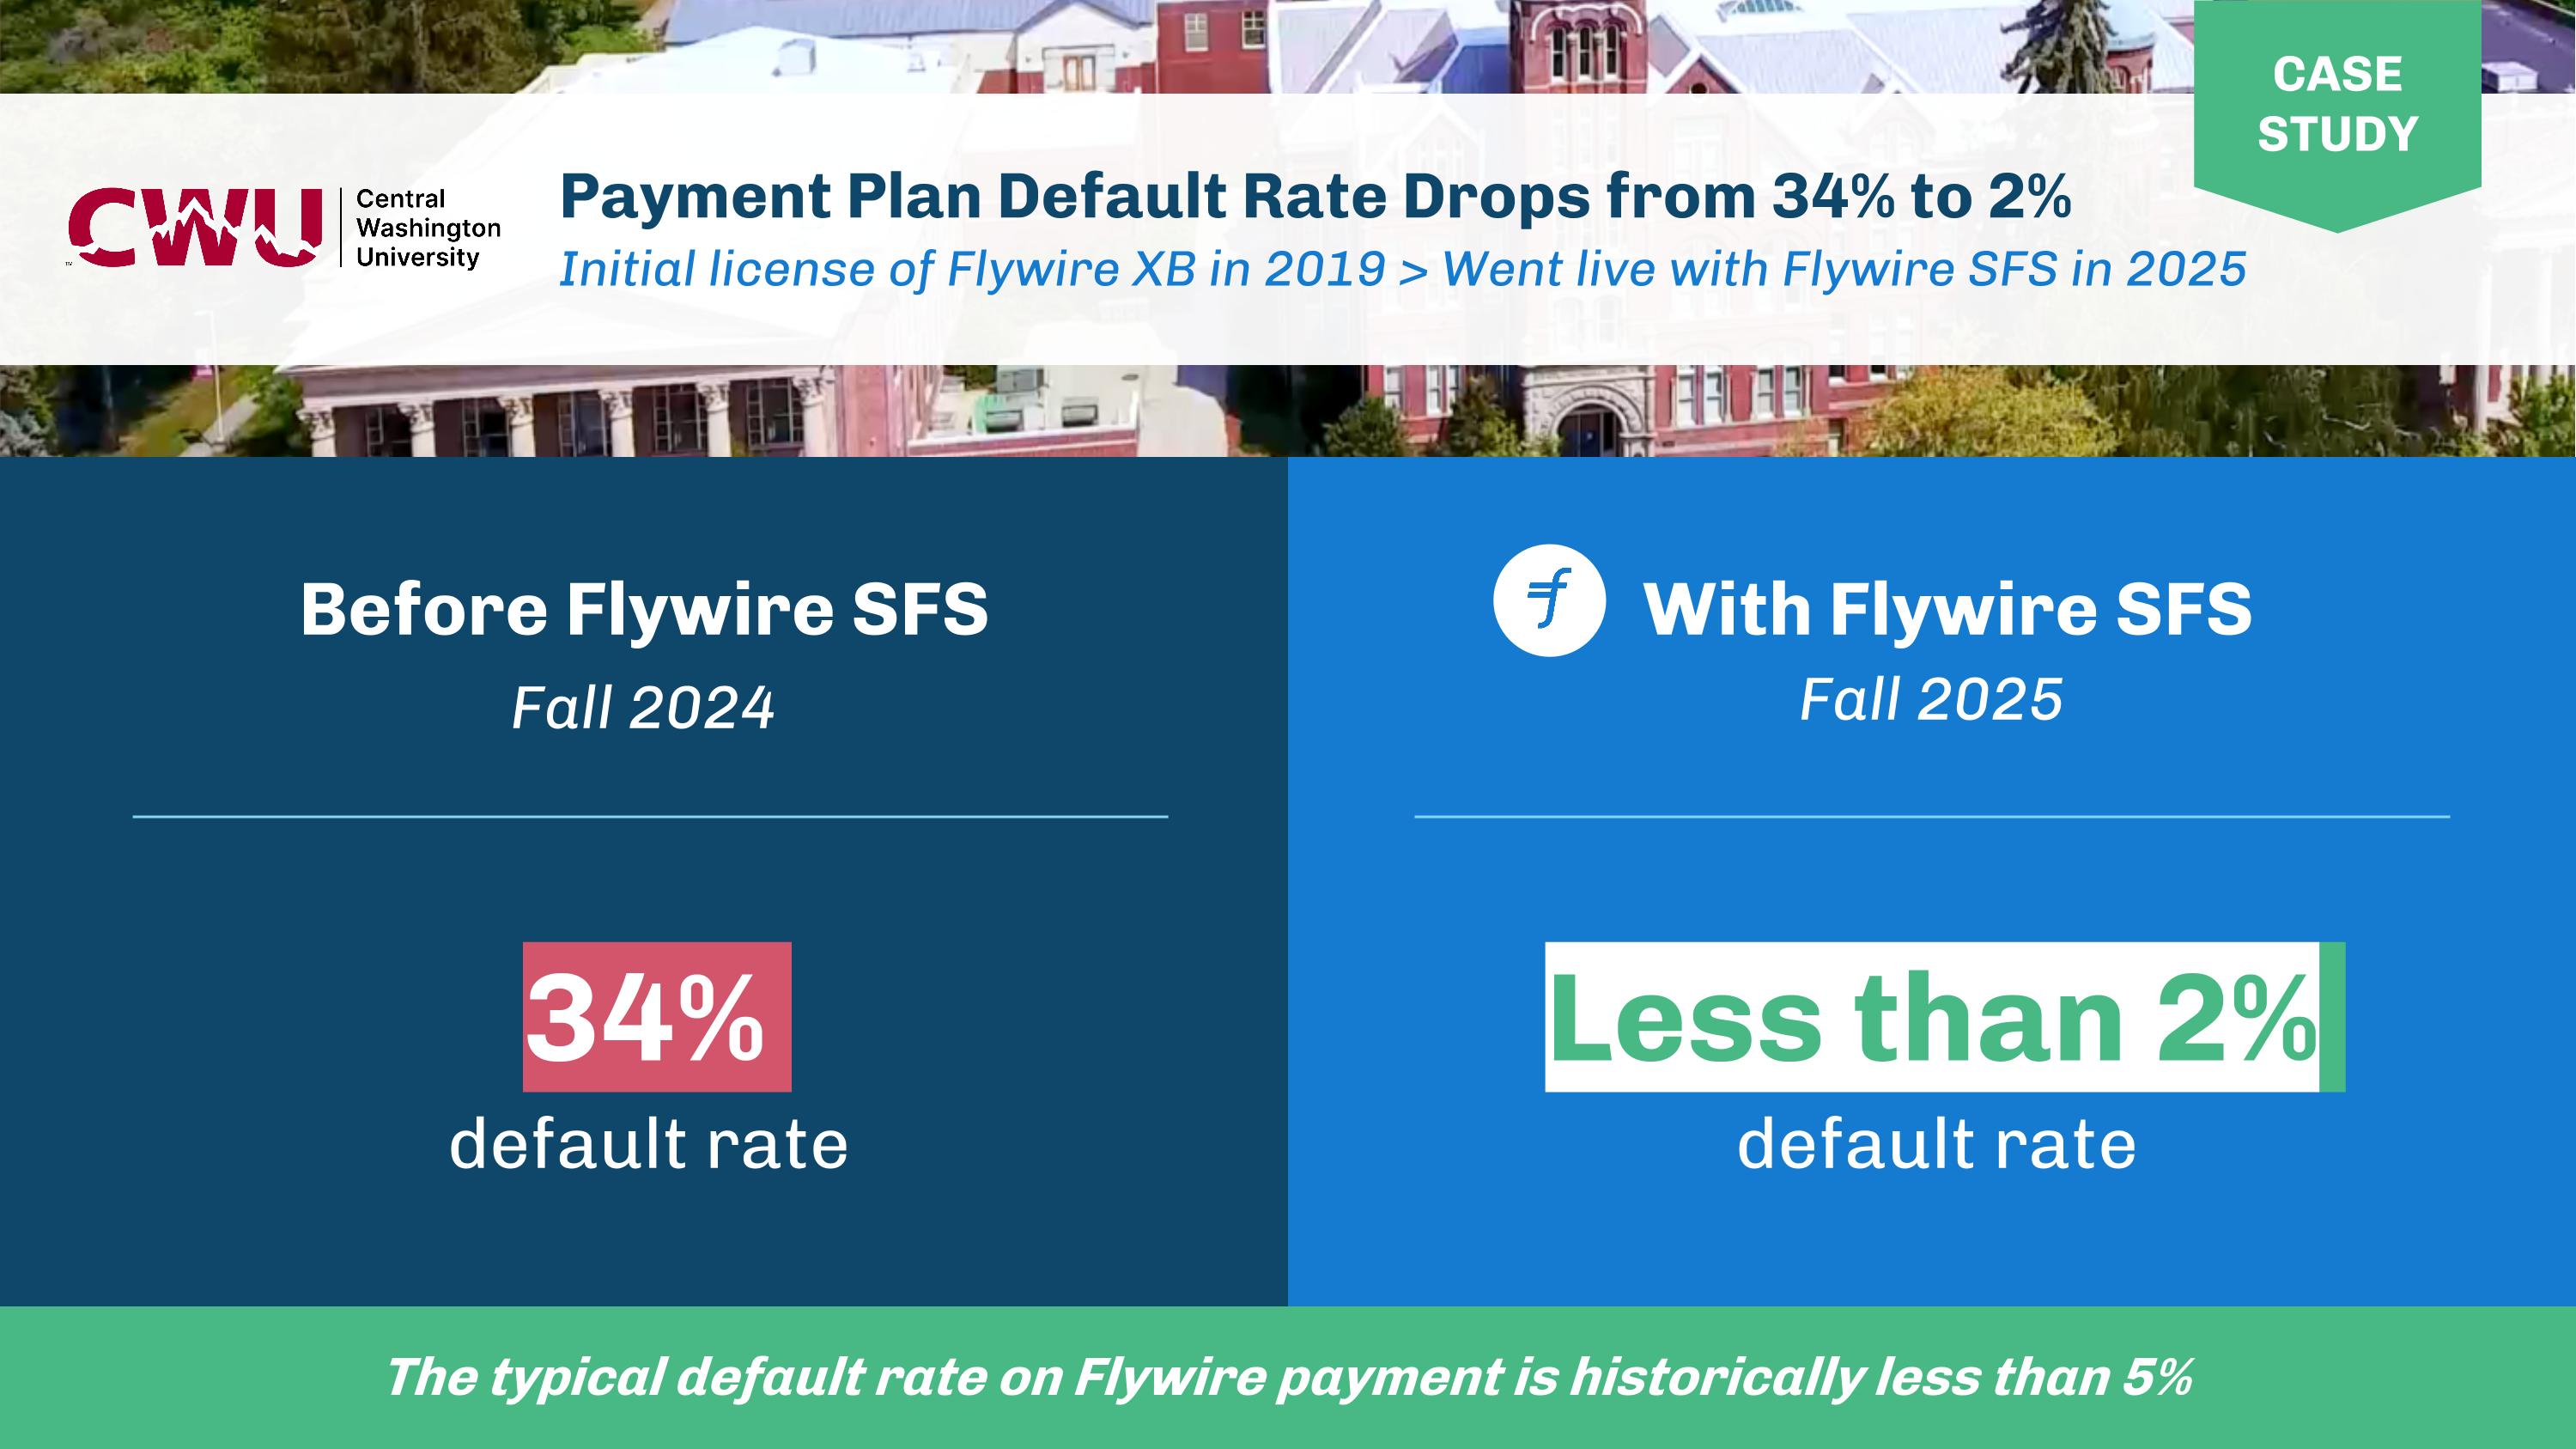
CASE STUDY Before Flywire SFS�Fall 2024 With Flywire SFS Payment Plan Default Rate Drops from 34% to 2% Initial license of Flywire XB in 2019 > Went live with Flywire SFS in 2025 CASE STUDY The typical default rate on Flywire payment is historically less than 5% 34% �default rate Less than 2% �default rate Fall 2025
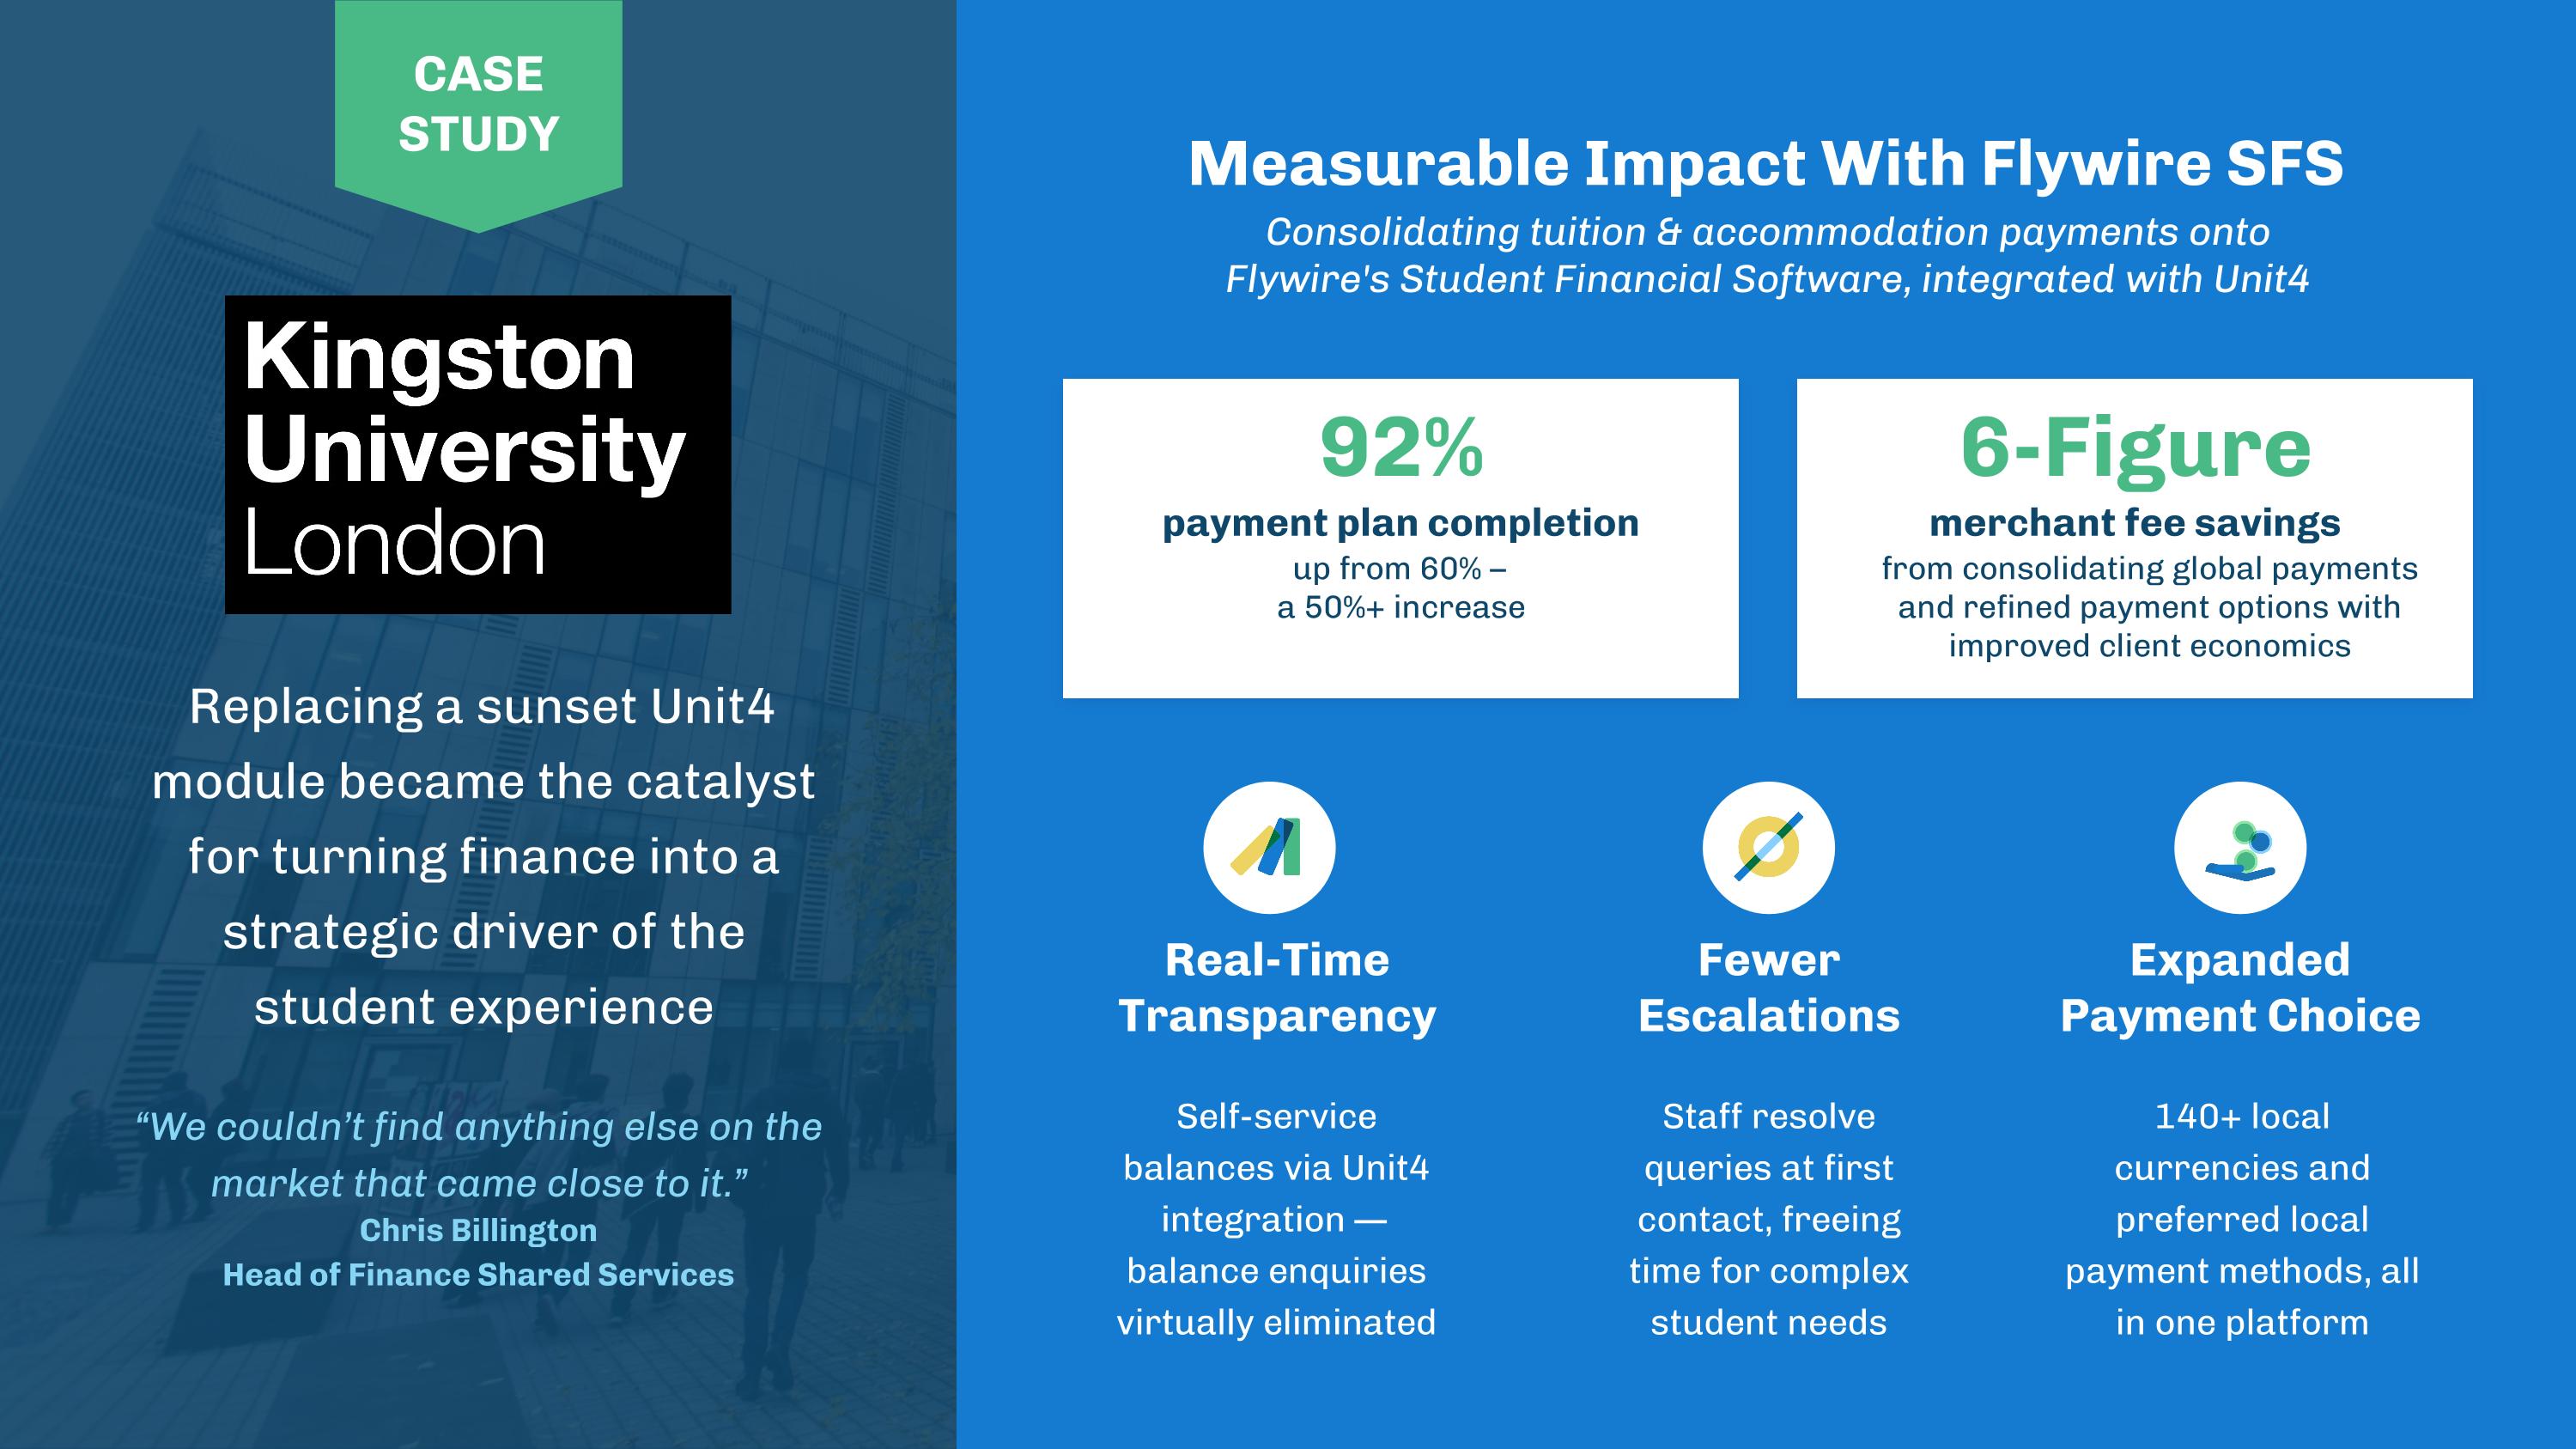
Replacing a sunset Unit4 module became the catalyst for turning finance into a strategic driver of the�student experience “We couldn’t find anything else on the market that came close to it.” Chris Billington Head of Finance Shared Services Measurable Impact With Flywire SFS Consolidating tuition & accommodation payments onto�Flywire's Student Financial Software, integrated with Unit4 92% payment plan completion up from 60% –�a 50%+ increase 6-Figure merchant fee savings from consolidating global payments and refined payment options with improved client economics Real-Time Transparency Self-service balances via Unit4 integration — balance enquiries virtually eliminated Fewer Escalations Staff resolve�queries at first contact, freeing�time for complex student needs Expanded Payment Choice 140+ local currencies and preferred local payment methods, all in one platform CASE STUDY

Spotlight: Digital Transformation (ADAPT)
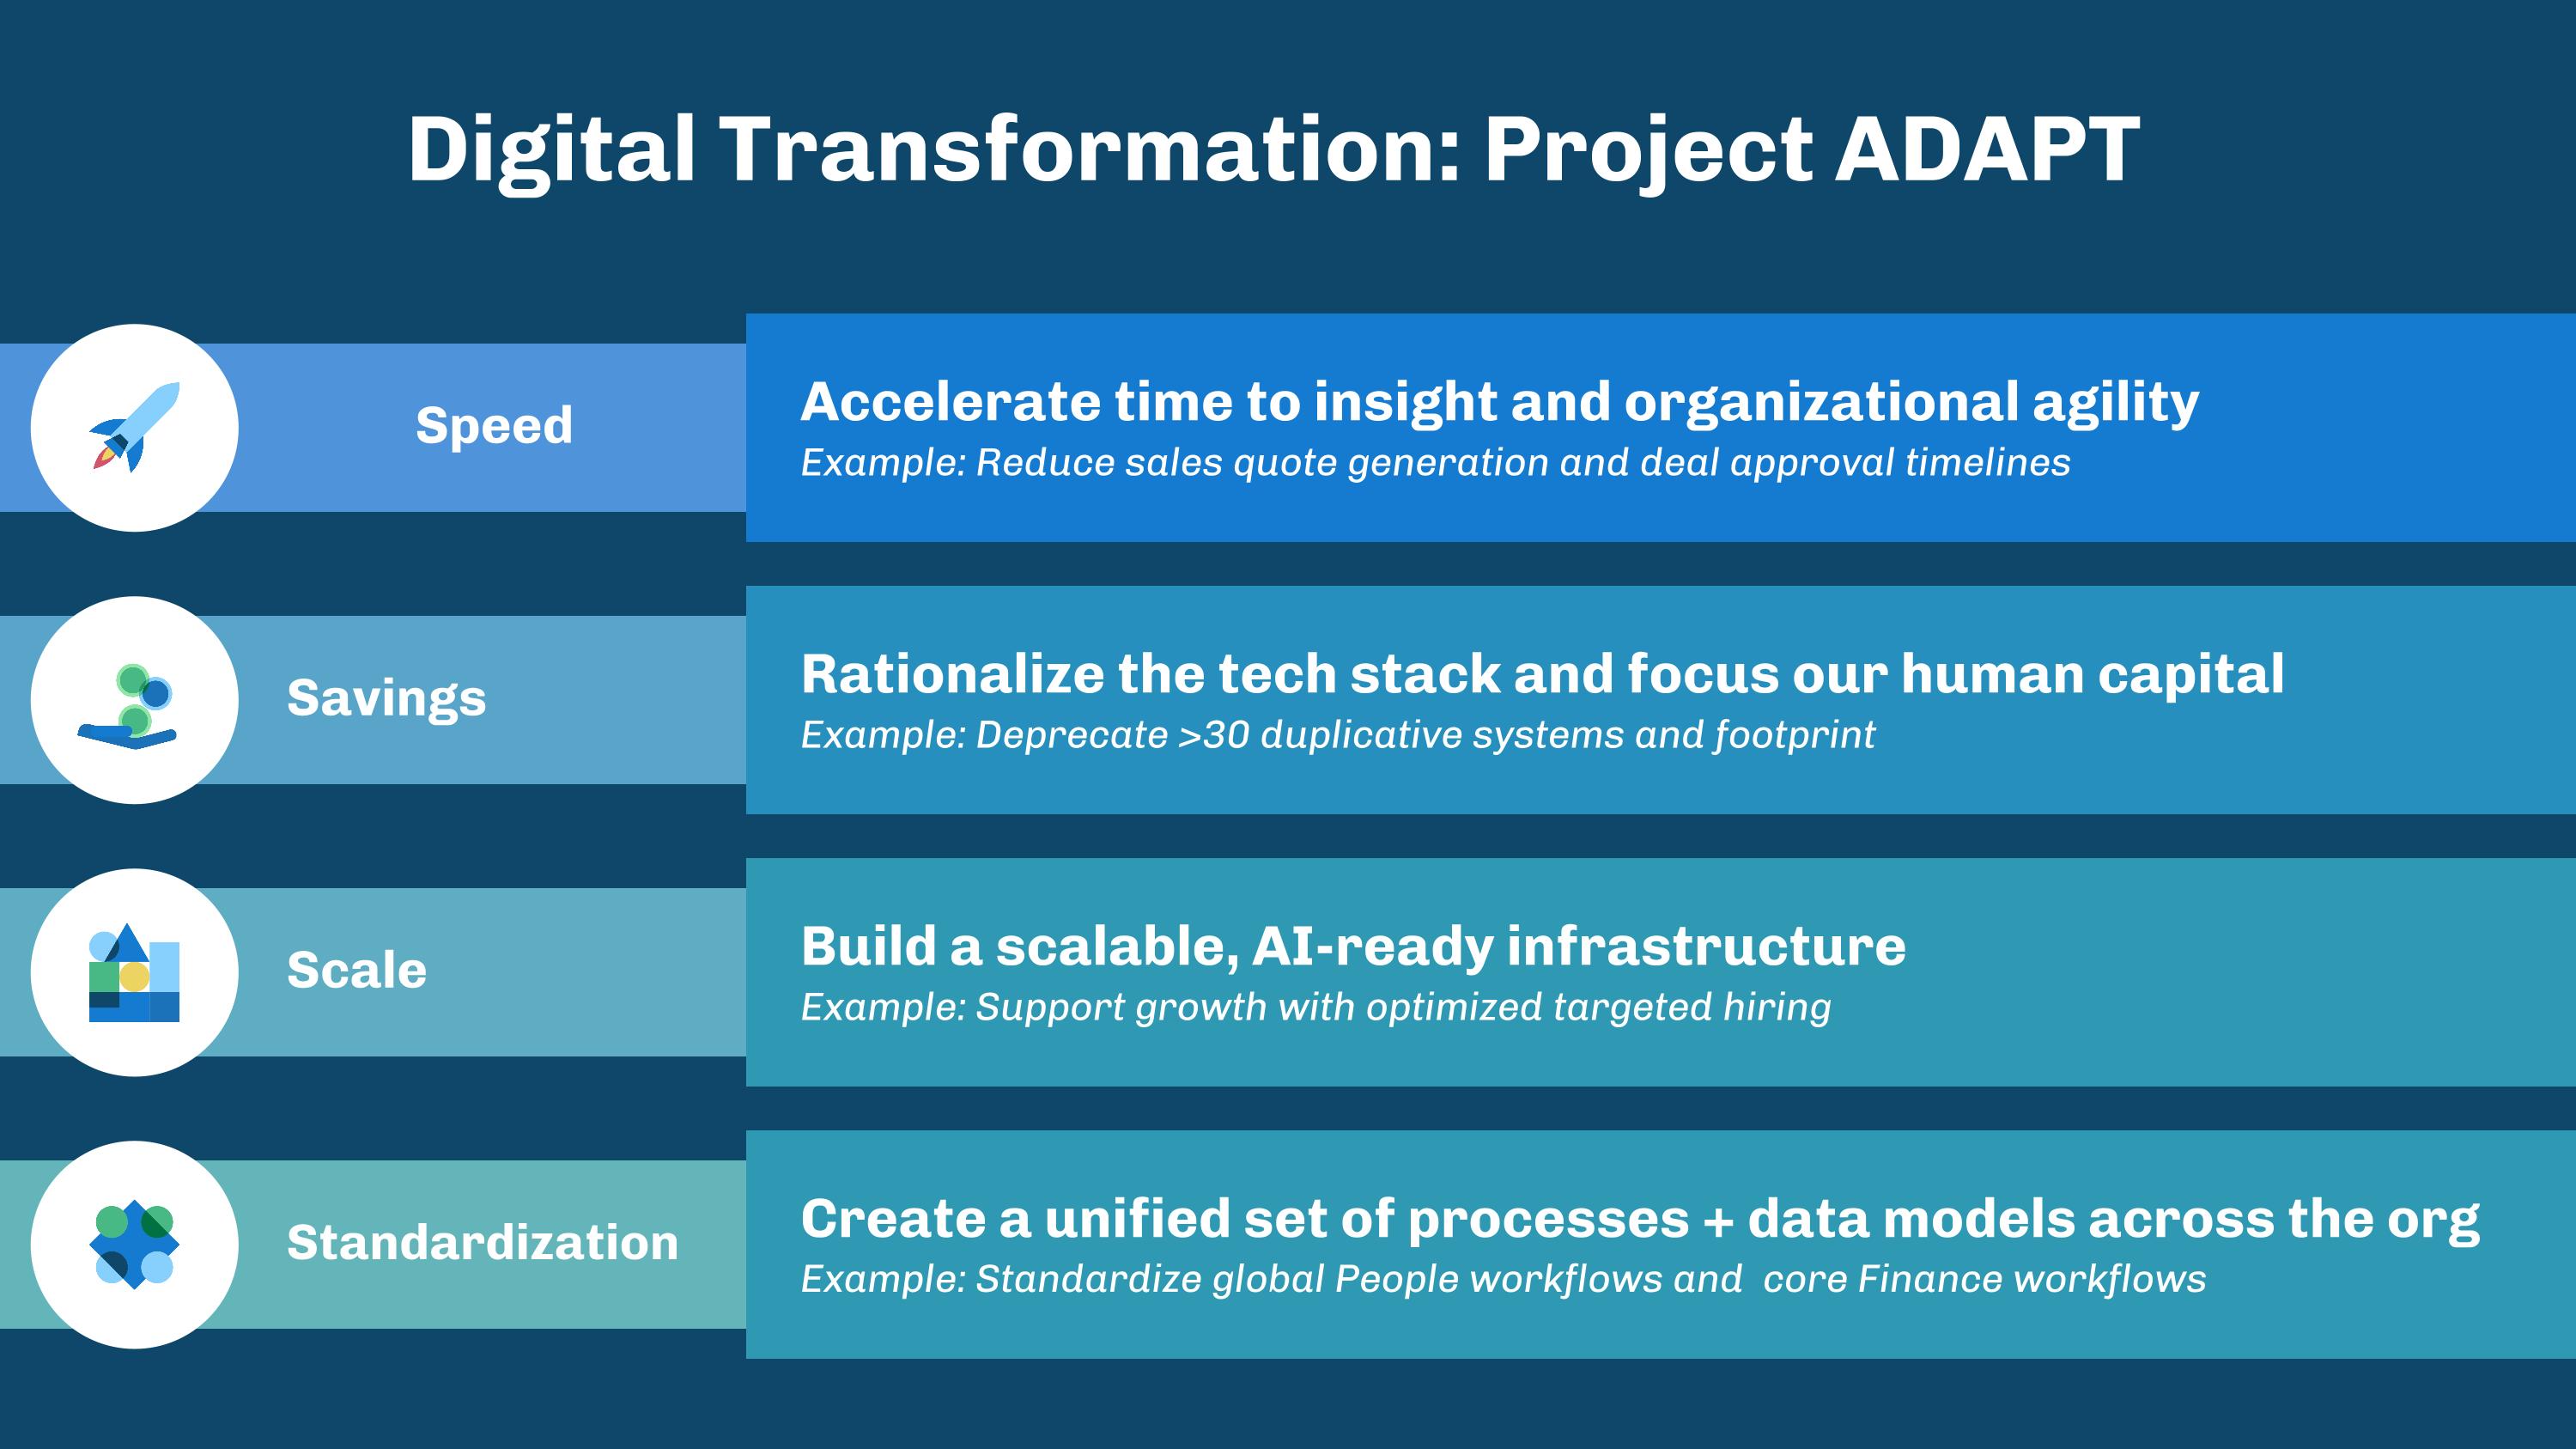
Digital Transformation: Project ADAPT Speed Savings Scale Accelerate time to insight and organizational agility Example: Reduce sales quote generation and deal approval timelines Rationalize the tech stack and focus our human capital Example: Deprecate >30 duplicative systems and footprint Build a scalable, AI-ready infrastructure Example: Support growth with optimized targeted hiring Standardization Create a unified set of processes + data models across the org Example: Standardize global People workflows and core Finance workflows
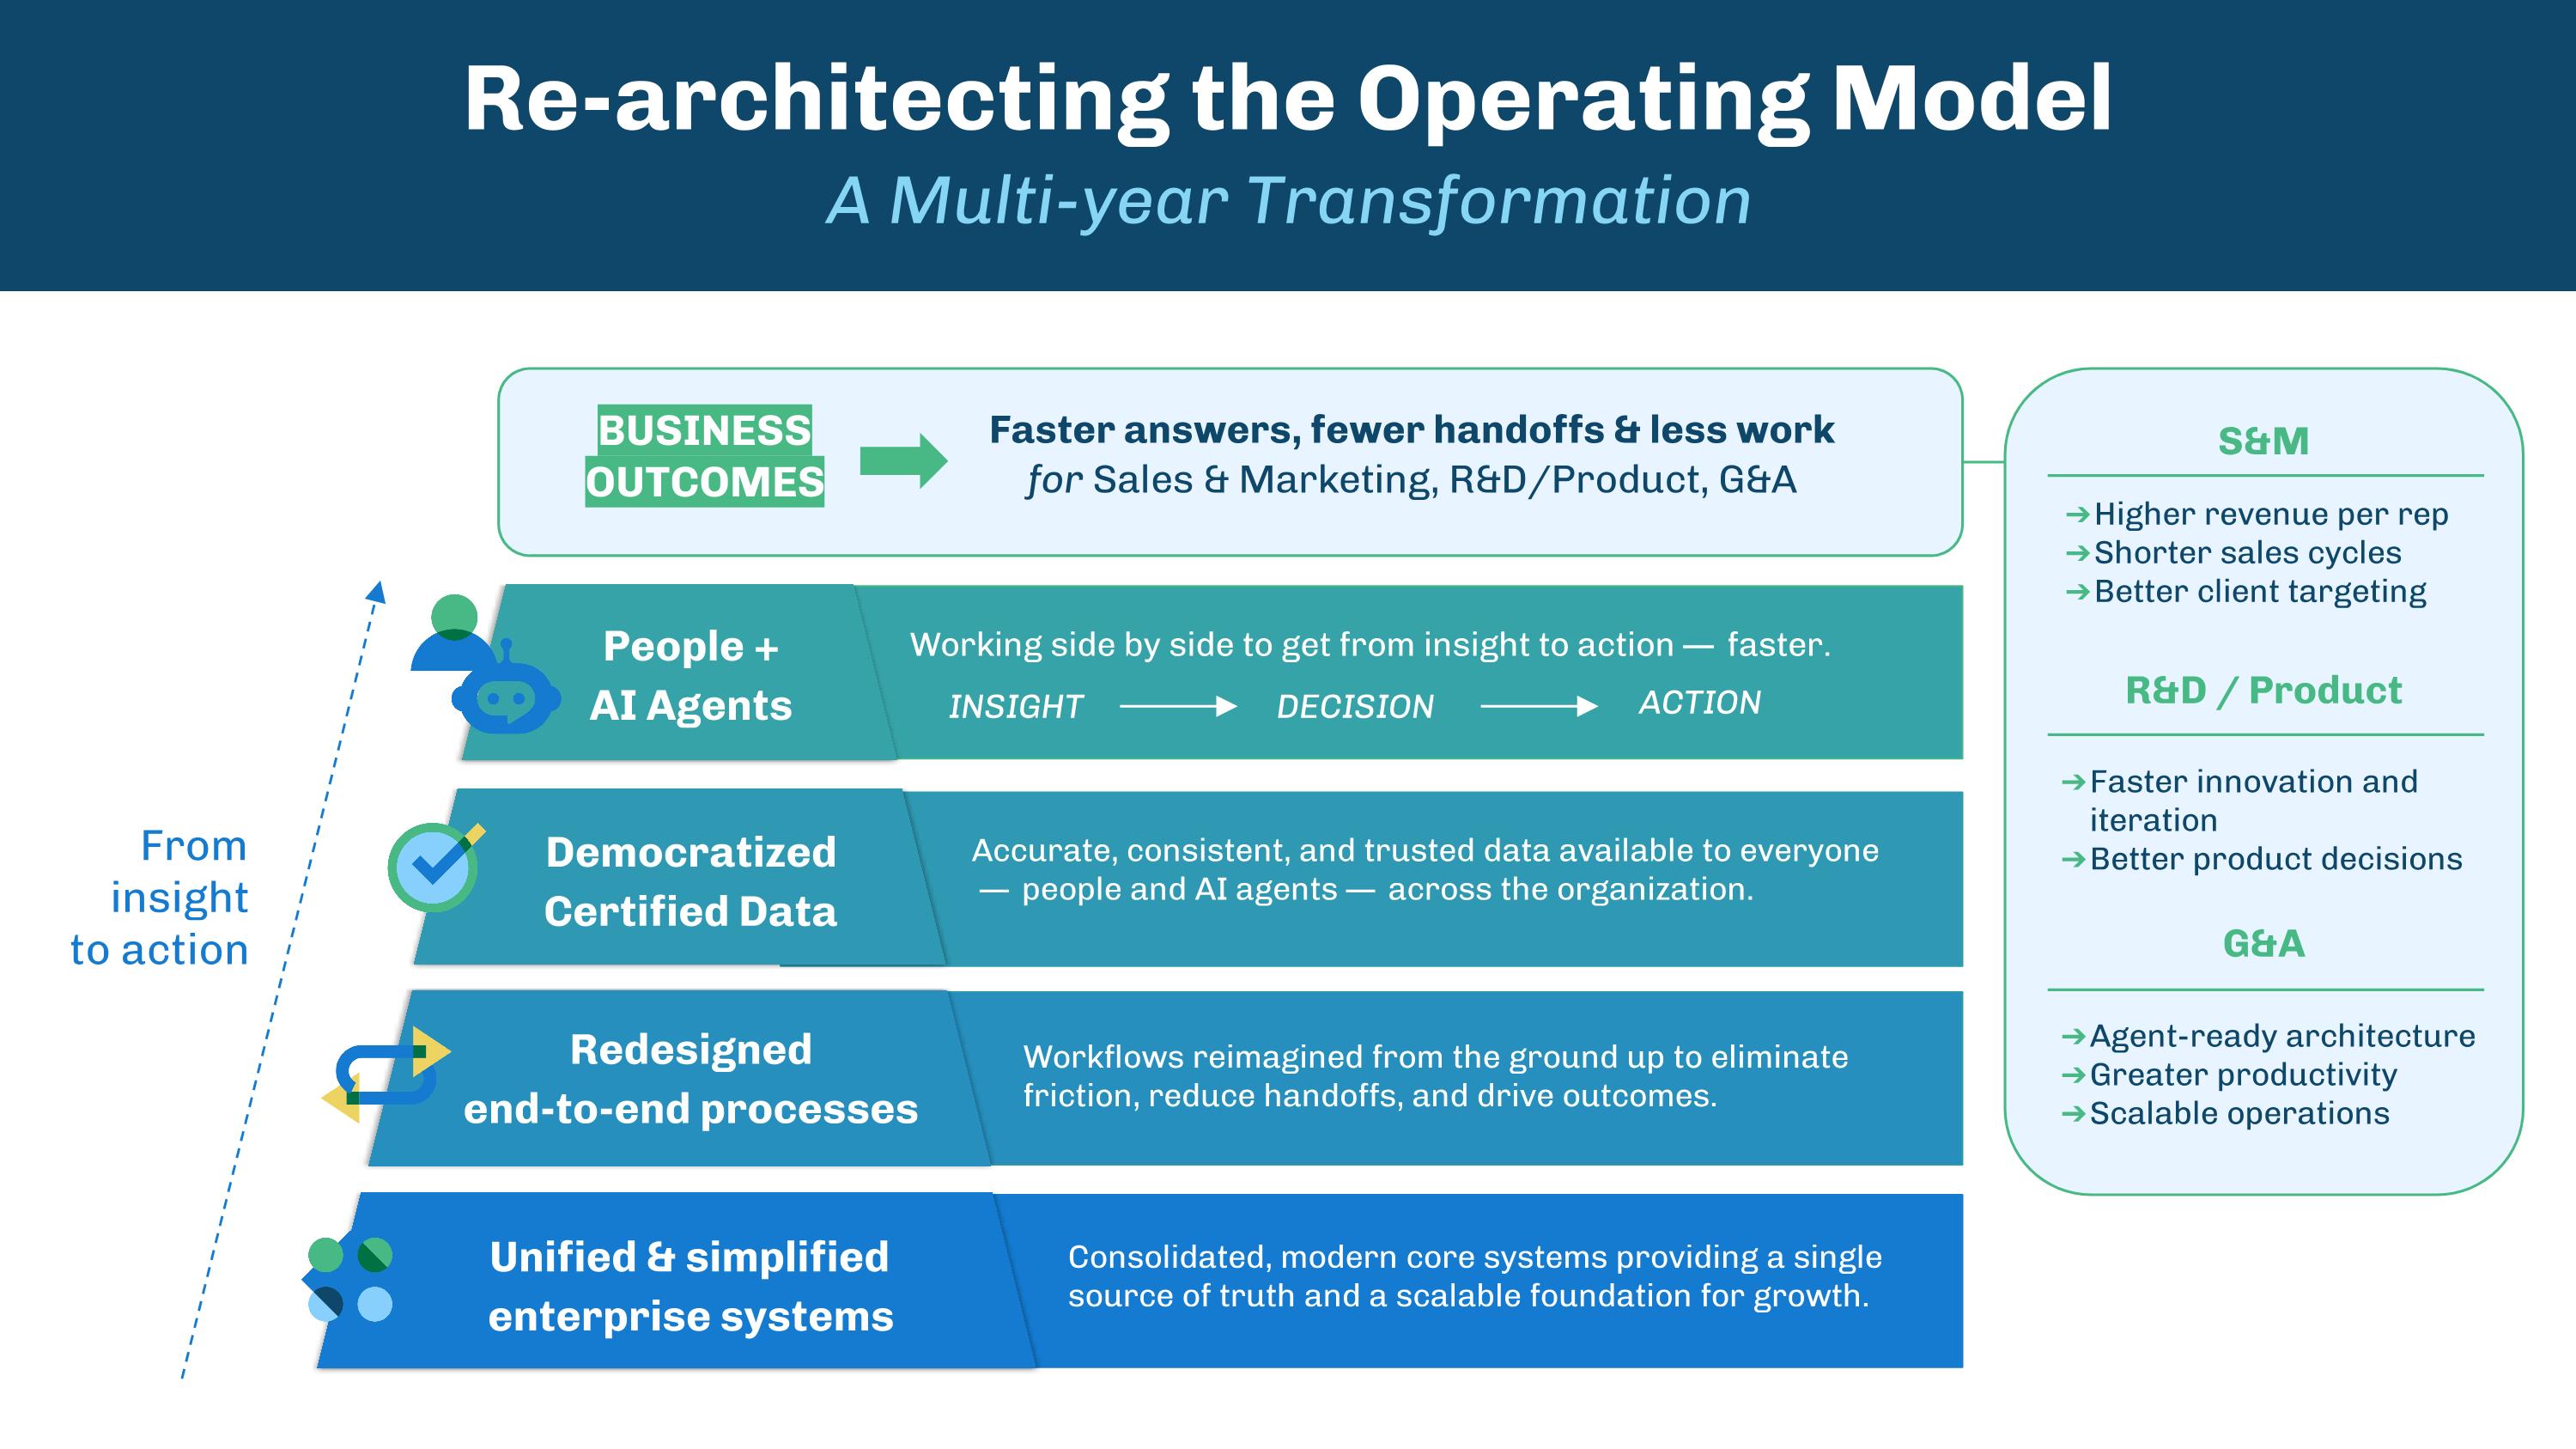
People + �AI Agents Democratized Certified Data Redesigned �end-to-end processes Unified & simplified enterprise systems Workflows reimagined from the ground up to eliminate friction, reduce handoffs, and drive outcomes. Consolidated, modern core systems providing a single source of truth and a scalable foundation for growth. Accurate, consistent, and trusted data available to everyone� — people and AI agents — across the organization. Working side by side to get from insight to action — faster. Re-architecting the Operating Model A Multi-year Transformation INSIGHT DECISION ACTION From �insight �to action BUSINESS OUTCOMES Faster answers, fewer handoffs & less work �for Sales & Marketing, R&D/Product, G&A S&M R&D / Product G&A Higher revenue per rep Shorter sales cycles Better client targeting Faster innovation and iteration Better product decisions Agent-ready architecture Greater productivity Scalable operations
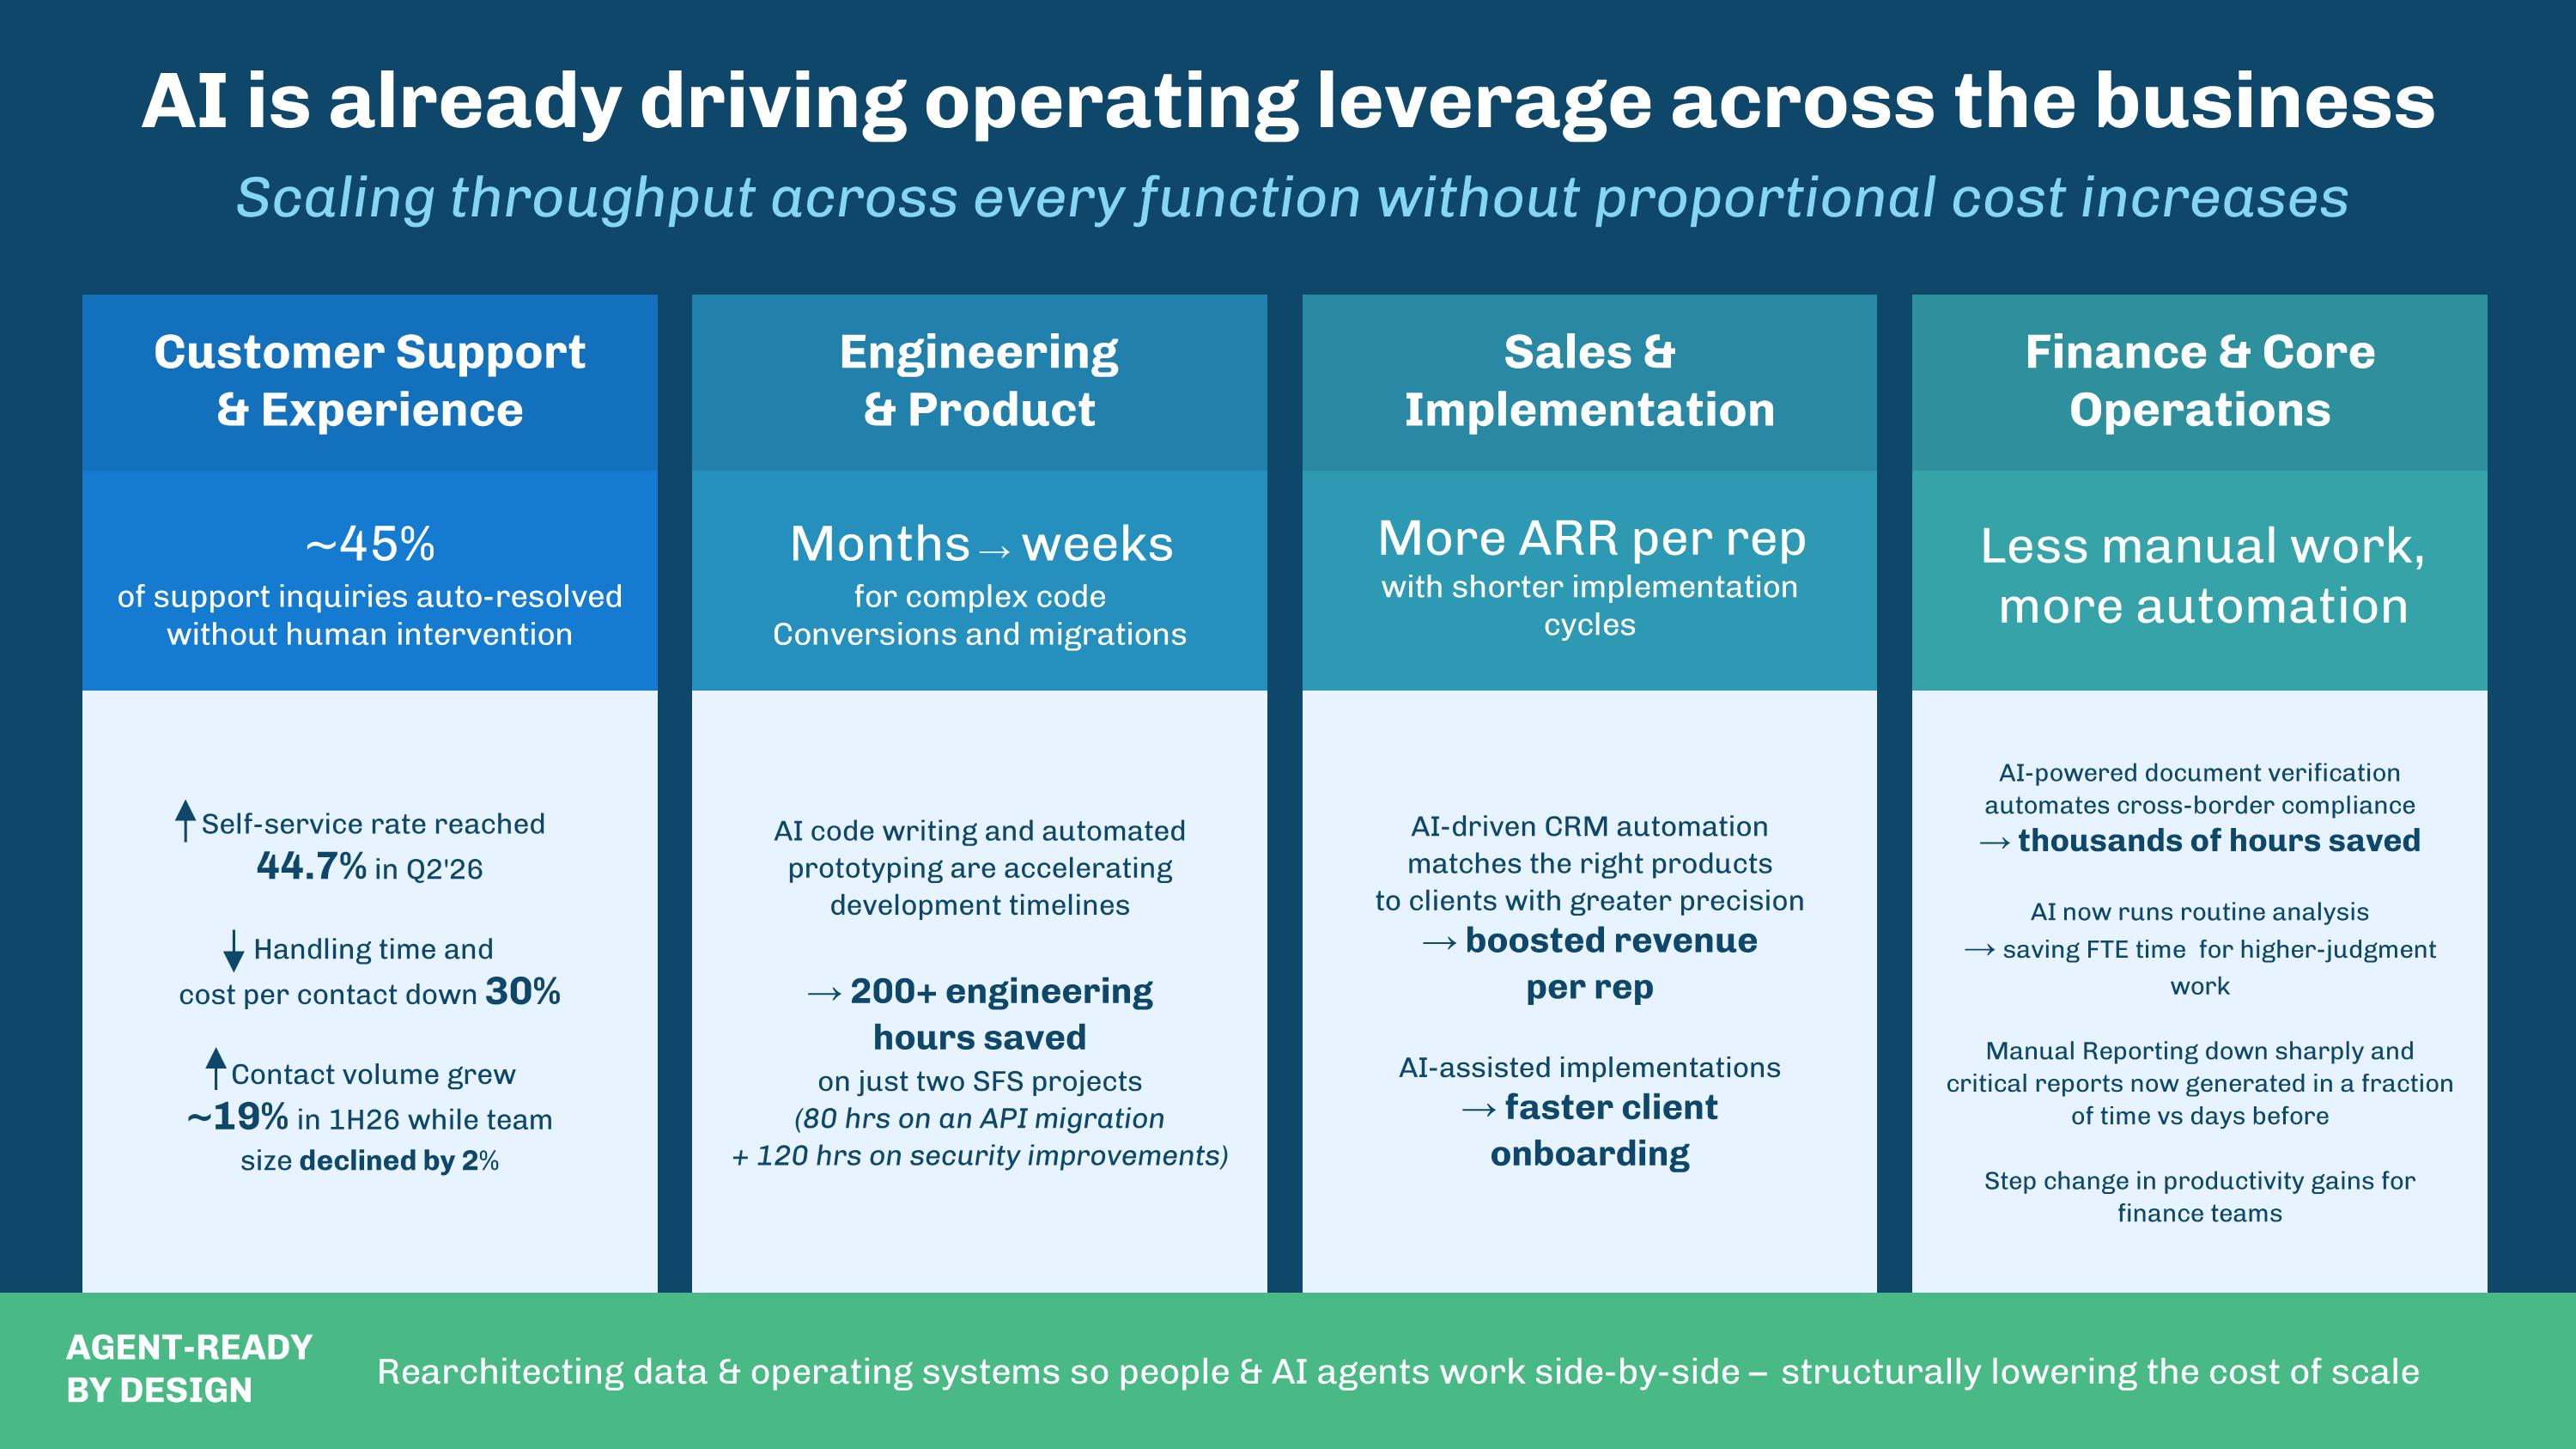
AI is already driving operating leverage across the business Scaling throughput across every function without proportional cost increases Rearchitecting data & operating systems so people & AI agents work side-by-side – structurally lowering the cost of scale AGENT-READY�BY DESIGN More ARR per rep with shorter implementation cycles ~45% �of support inquiries auto-resolved without human intervention Months → weeks �for complex code�Conversions and migrations Less manual work, more automation Customer Support�& Experience Engineering�& Product Sales & Implementation Finance & Core Operations Self-service rate reached�44.7% in Q2'26 Handling time and�cost per contact down 30%�� Contact volume grew�~19% in 1H26 while team�size declined by 2% AI code writing and automated prototyping are accelerating development timelines → 200+ engineering�hours saved�on just two SFS projects�(80 hrs on an API migration�+ 120 hrs on security improvements) AI-driven CRM automation�matches the right products�to clients with greater precision�→ boosted revenue�per rep AI-assisted implementations�→ faster client�onboarding AI-powered document verification�automates cross-border compliance�→ thousands of hours saved��AI now runs routine analysis�→ saving FTE time for higher-judgment work Manual Reporting down sharply and critical reports now generated in a fraction of time vs days before Step change in productivity gains for finance teams
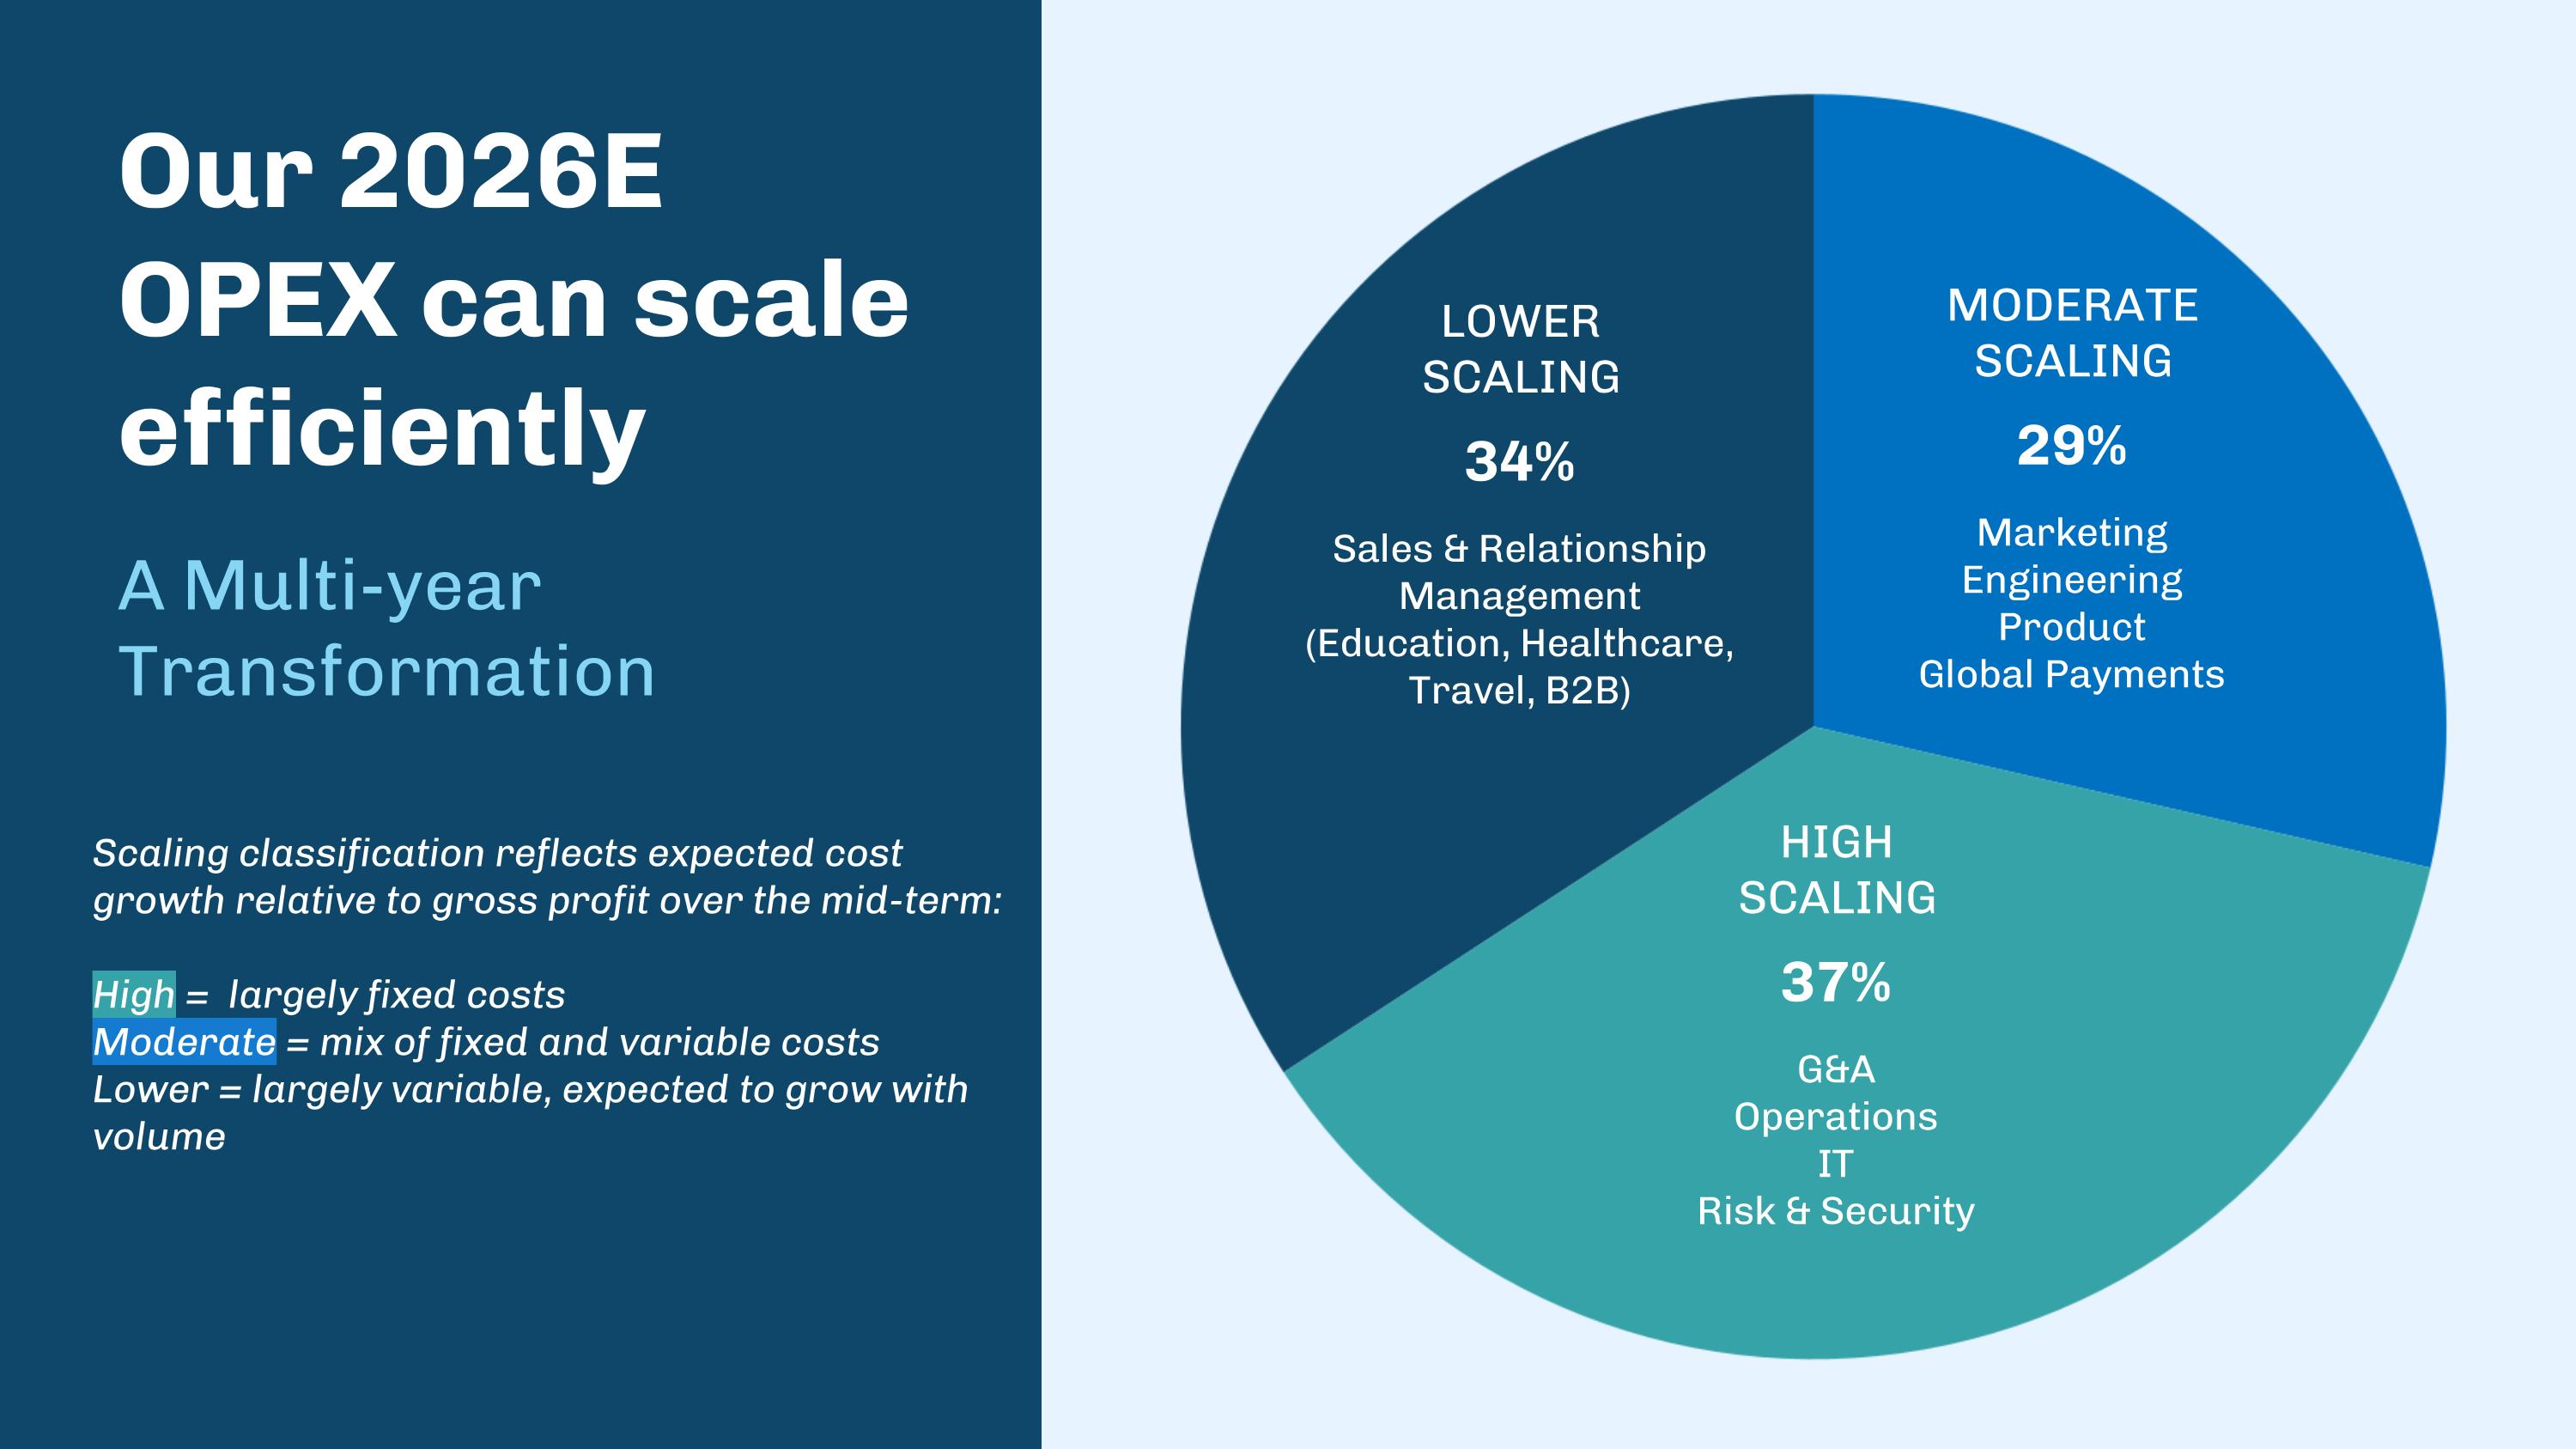
Our 2026E OPEX can scale efficiently A Multi-year Transformation LOWER�SCALING 34% Sales & Relationship Management�(Education, Healthcare, Travel, B2B) MODERATE�SCALING 29% Marketing�Engineering�Product�Global Payments HIGH�SCALING 37% G&A�Operations IT �Risk & Security Scaling classification reflects expected cost growth relative to gross profit over the mid-term: High = largely fixed costs Moderate = mix of fixed and variable costs Lower = largely variable, expected to grow with volume
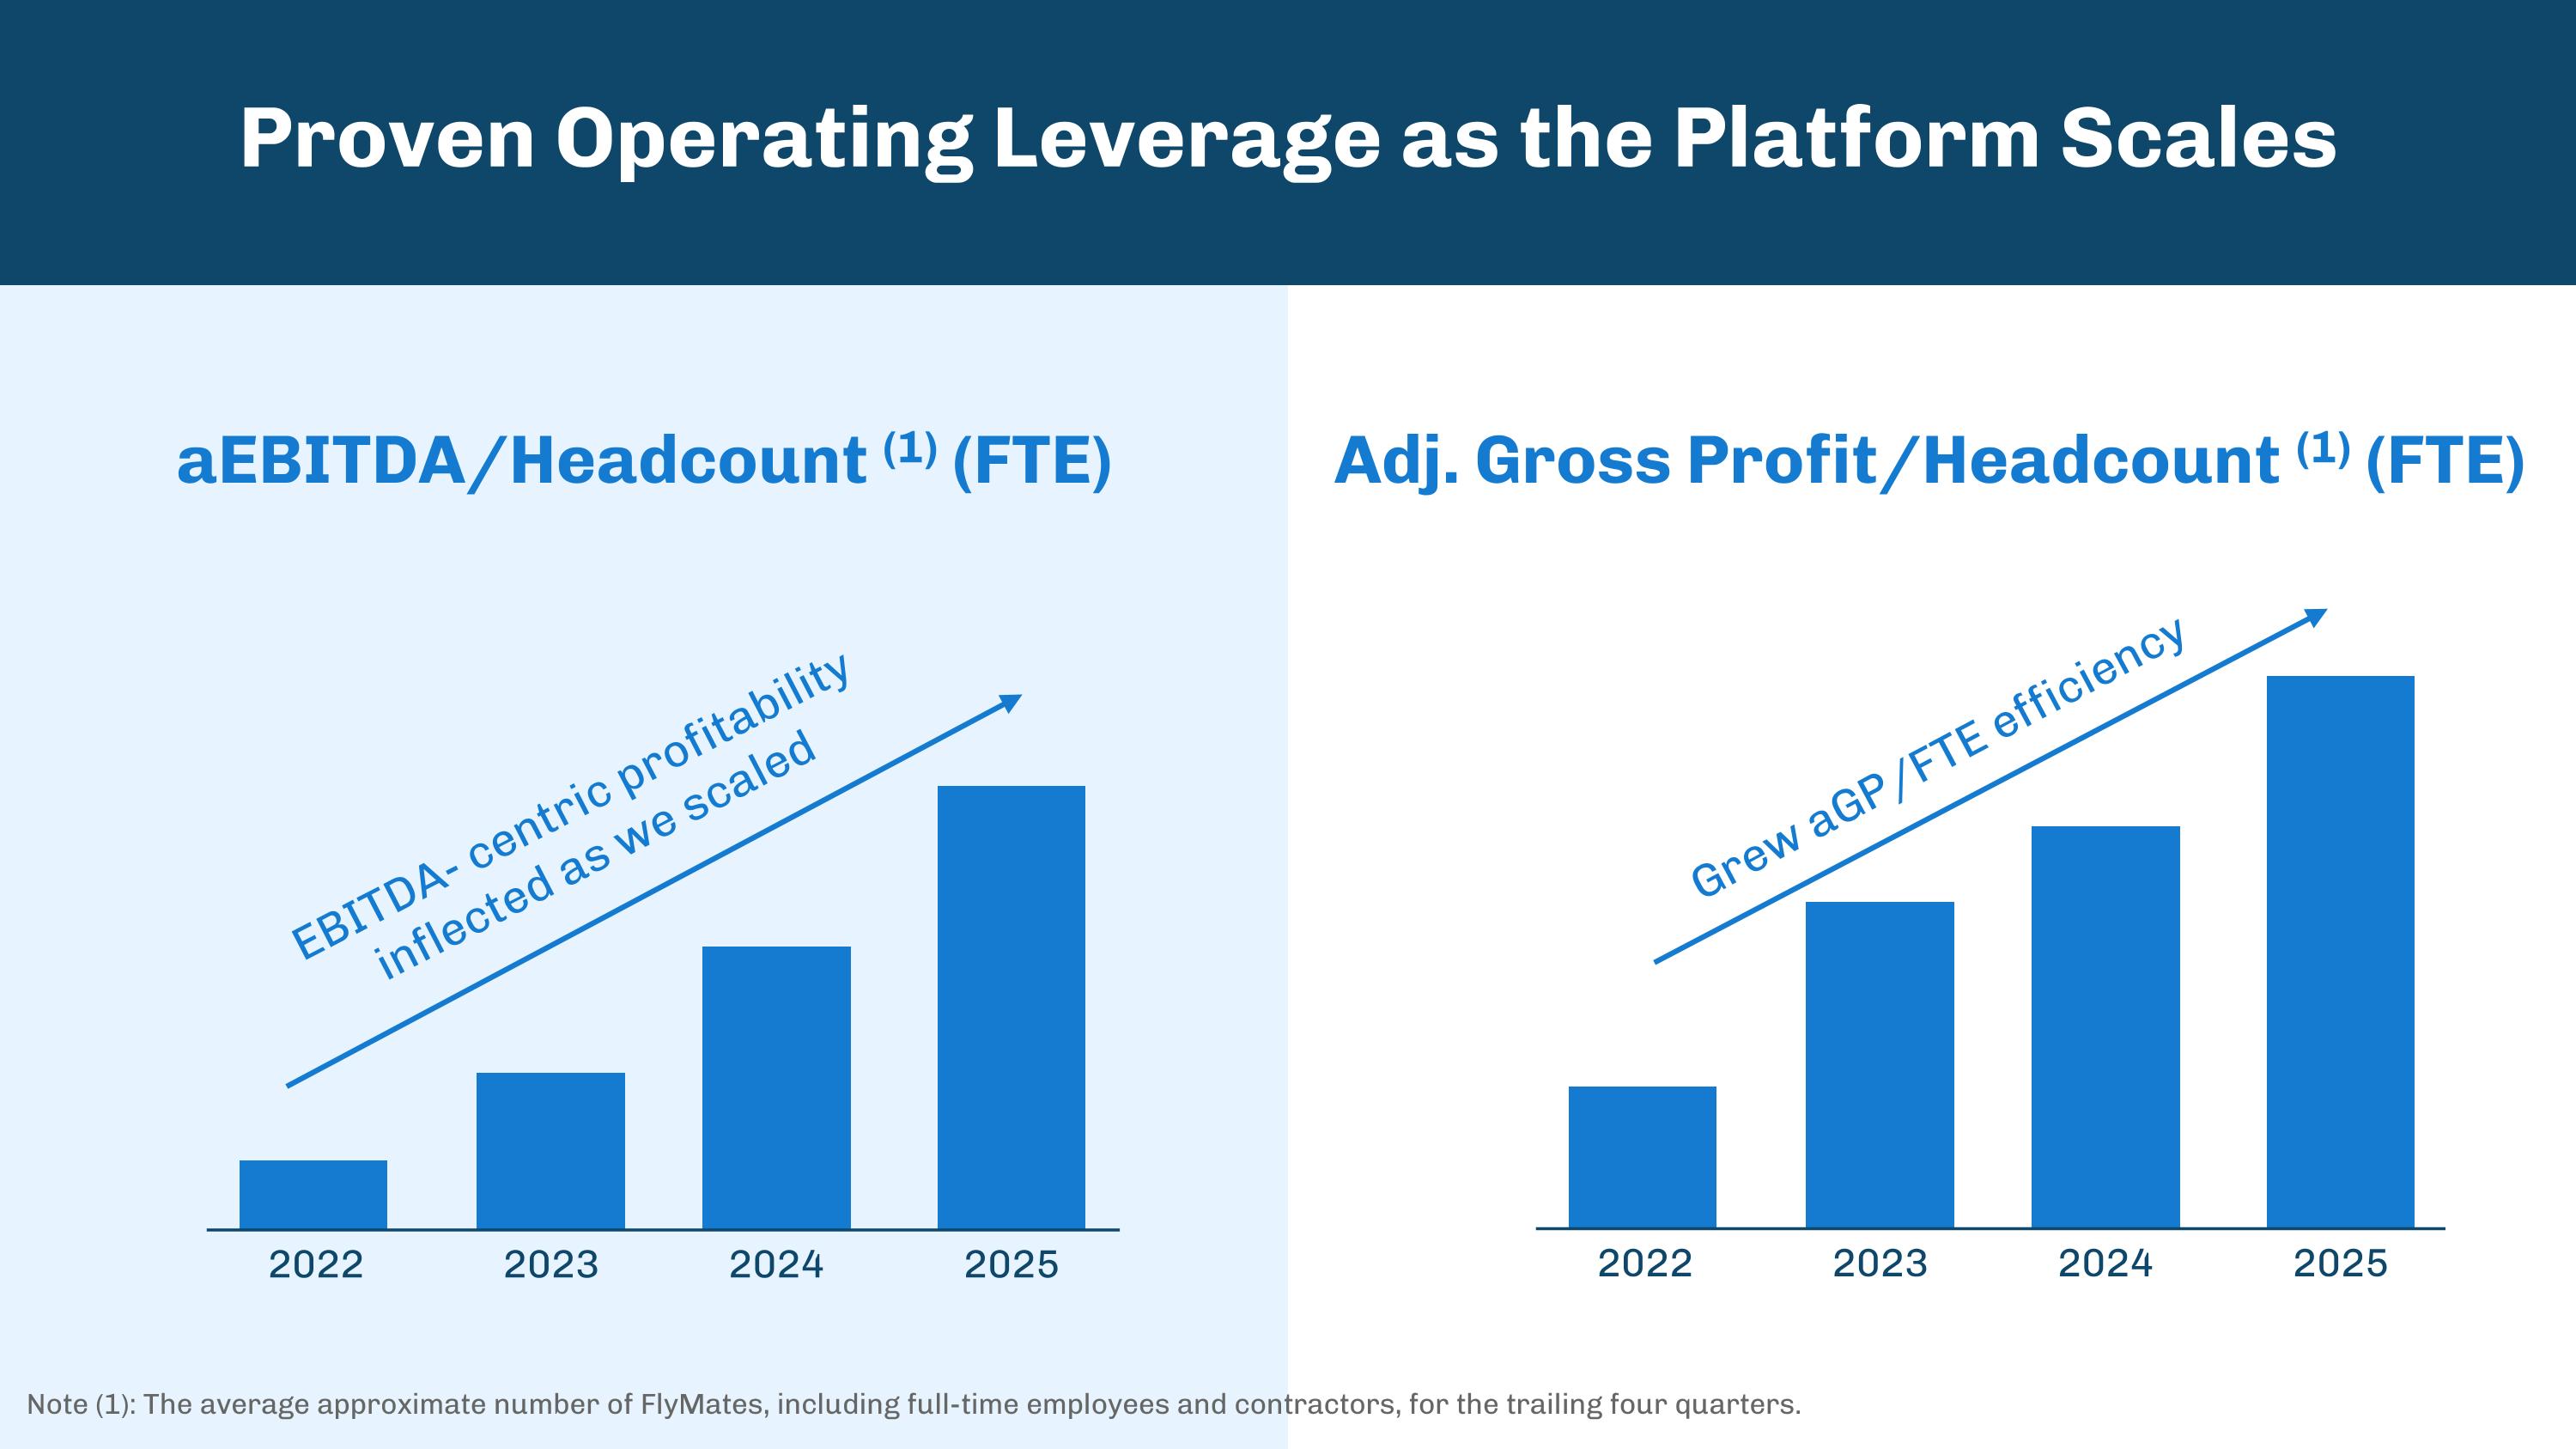
Proven Operating Leverage as the Platform Scales aEBITDA/Headcount (1) (FTE) Adj. Gross Profit/Headcount (1) (FTE) 2022 2023 2024 2025 2022 2023 2024 2025 EBITDA- centric profitability inflected as we scaled Grew aGP/FTE efficiency Note (1): The average approximate number of FlyMates, including full-time employees and contractors, for the trailing four quarters.
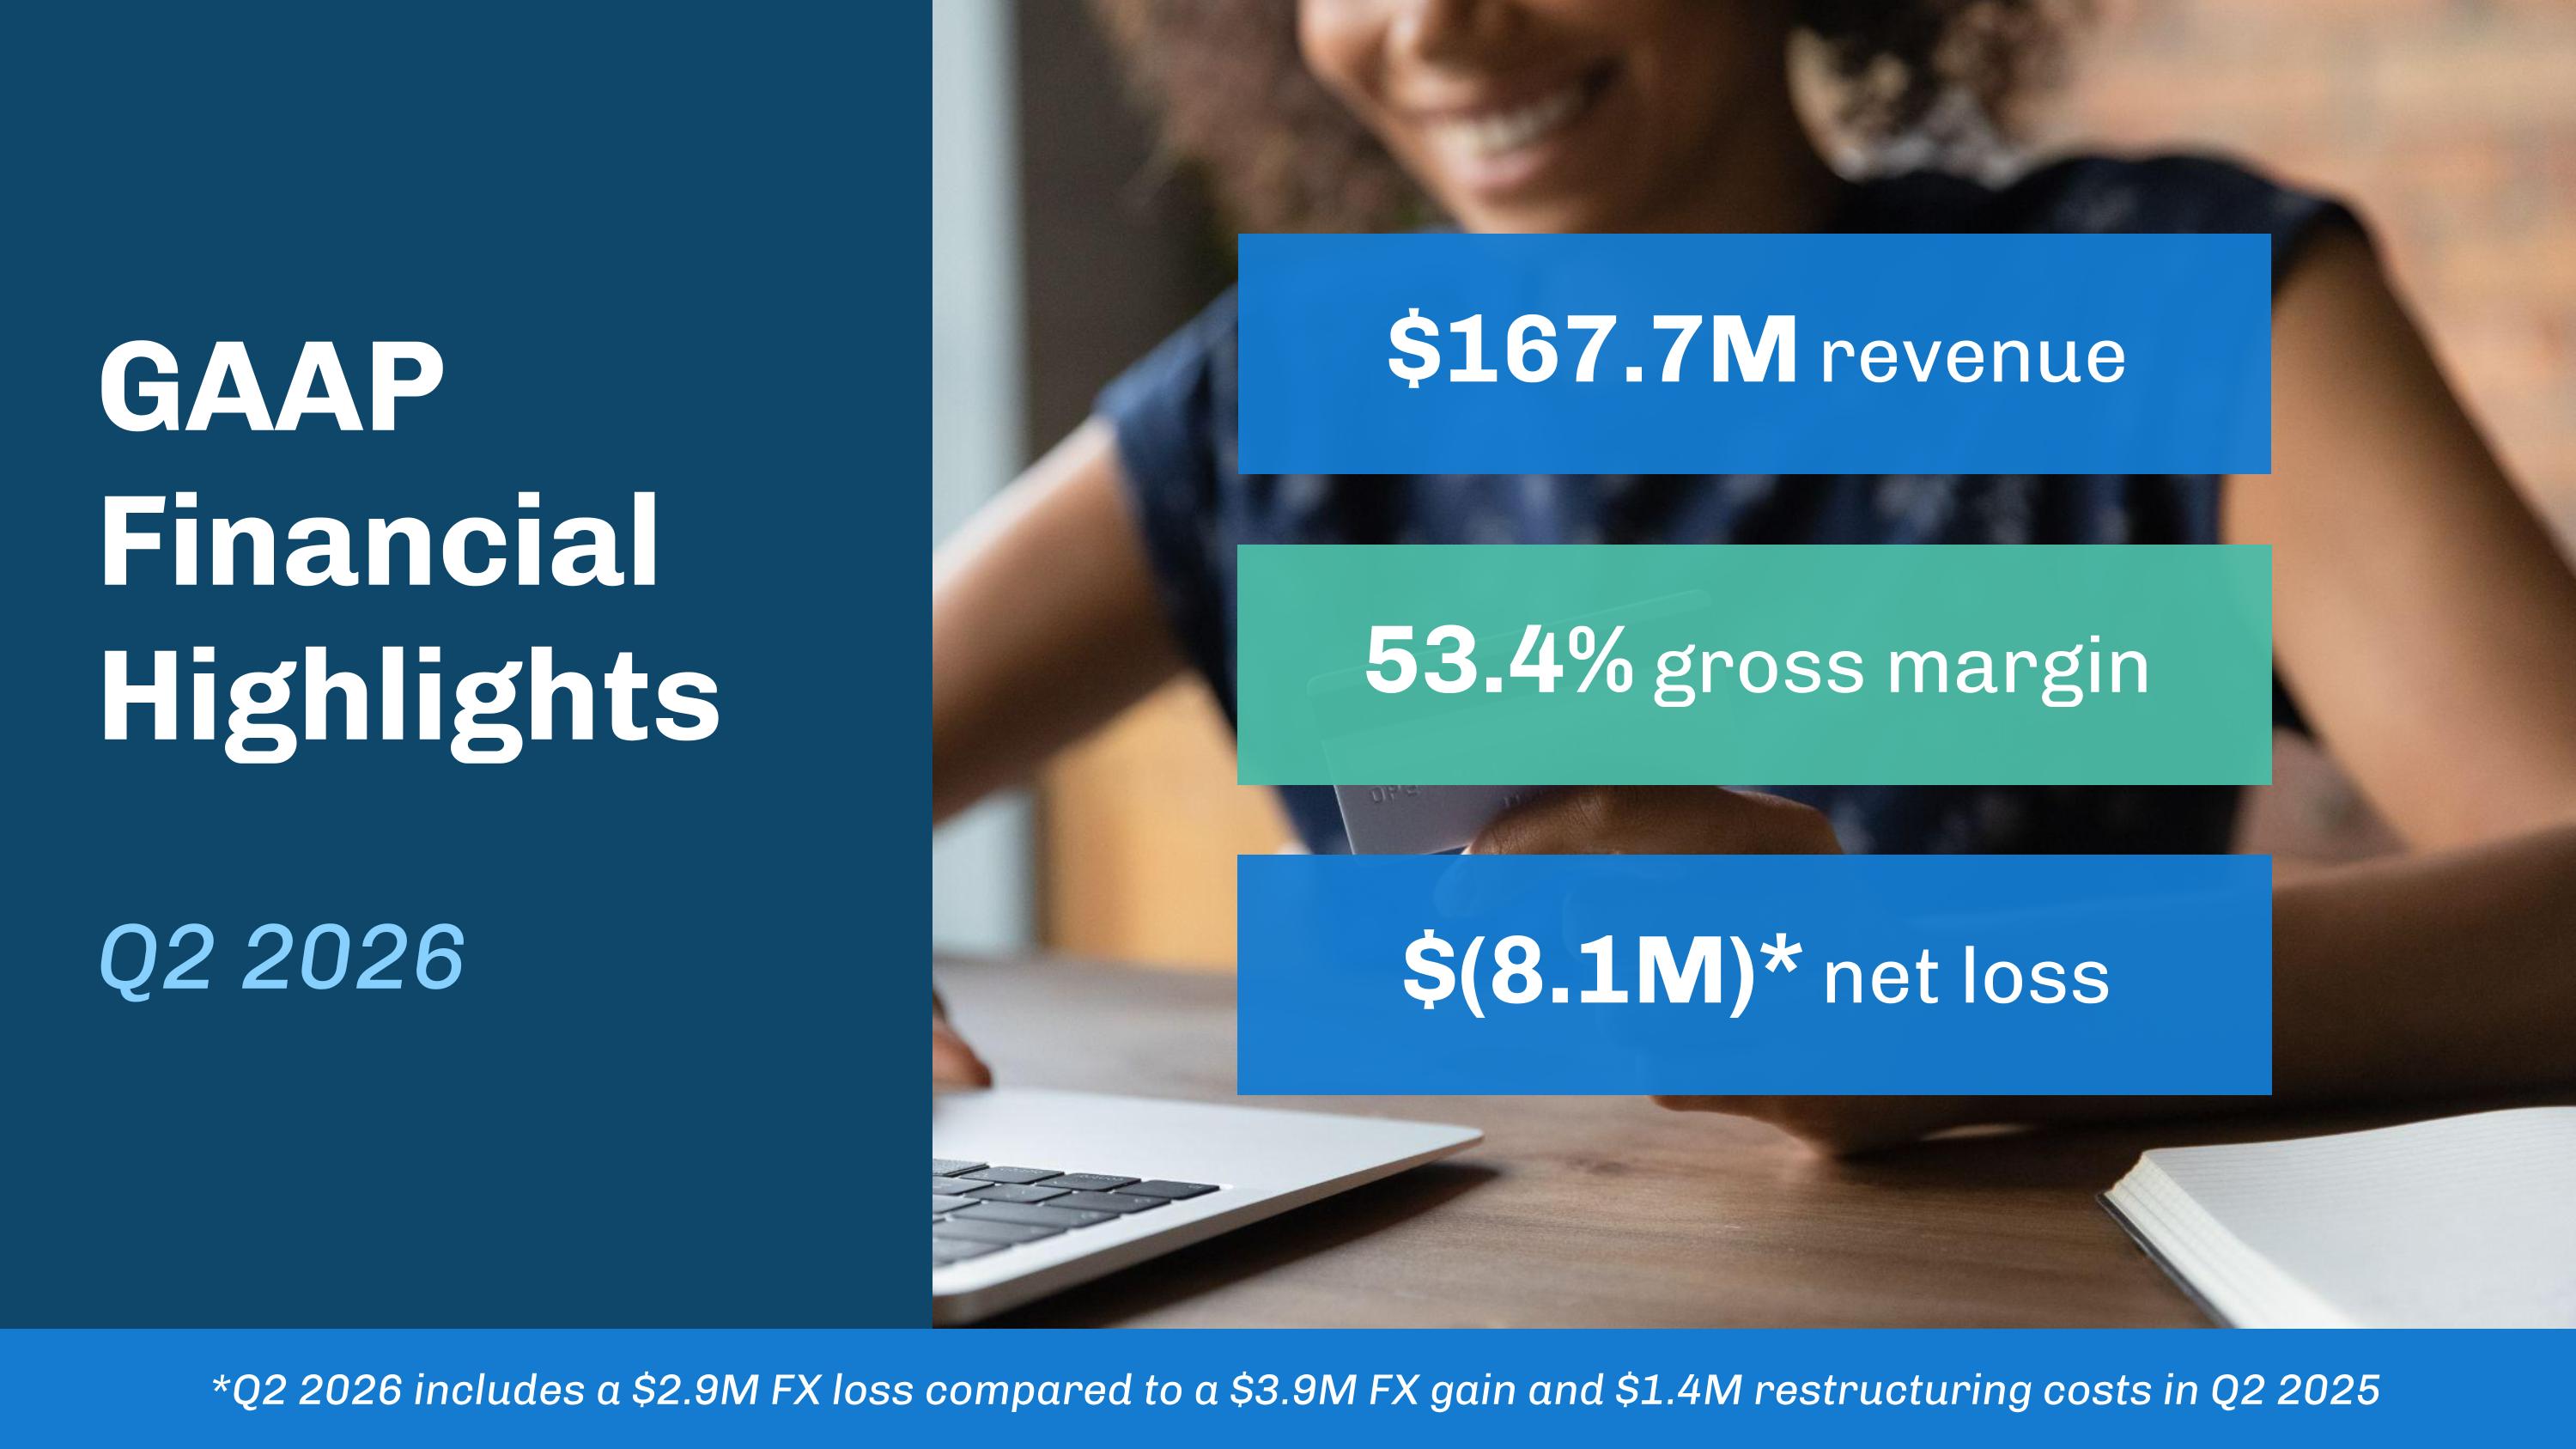
$167.7M revenue $(8.1M)* net loss 53.4% gross margin *Q2 2026 includes a $2.9M FX loss compared to a $3.9M FX gain and $1.4M restructuring costs in Q2 2025 GAAP�Financial Highlights��Q2 2026
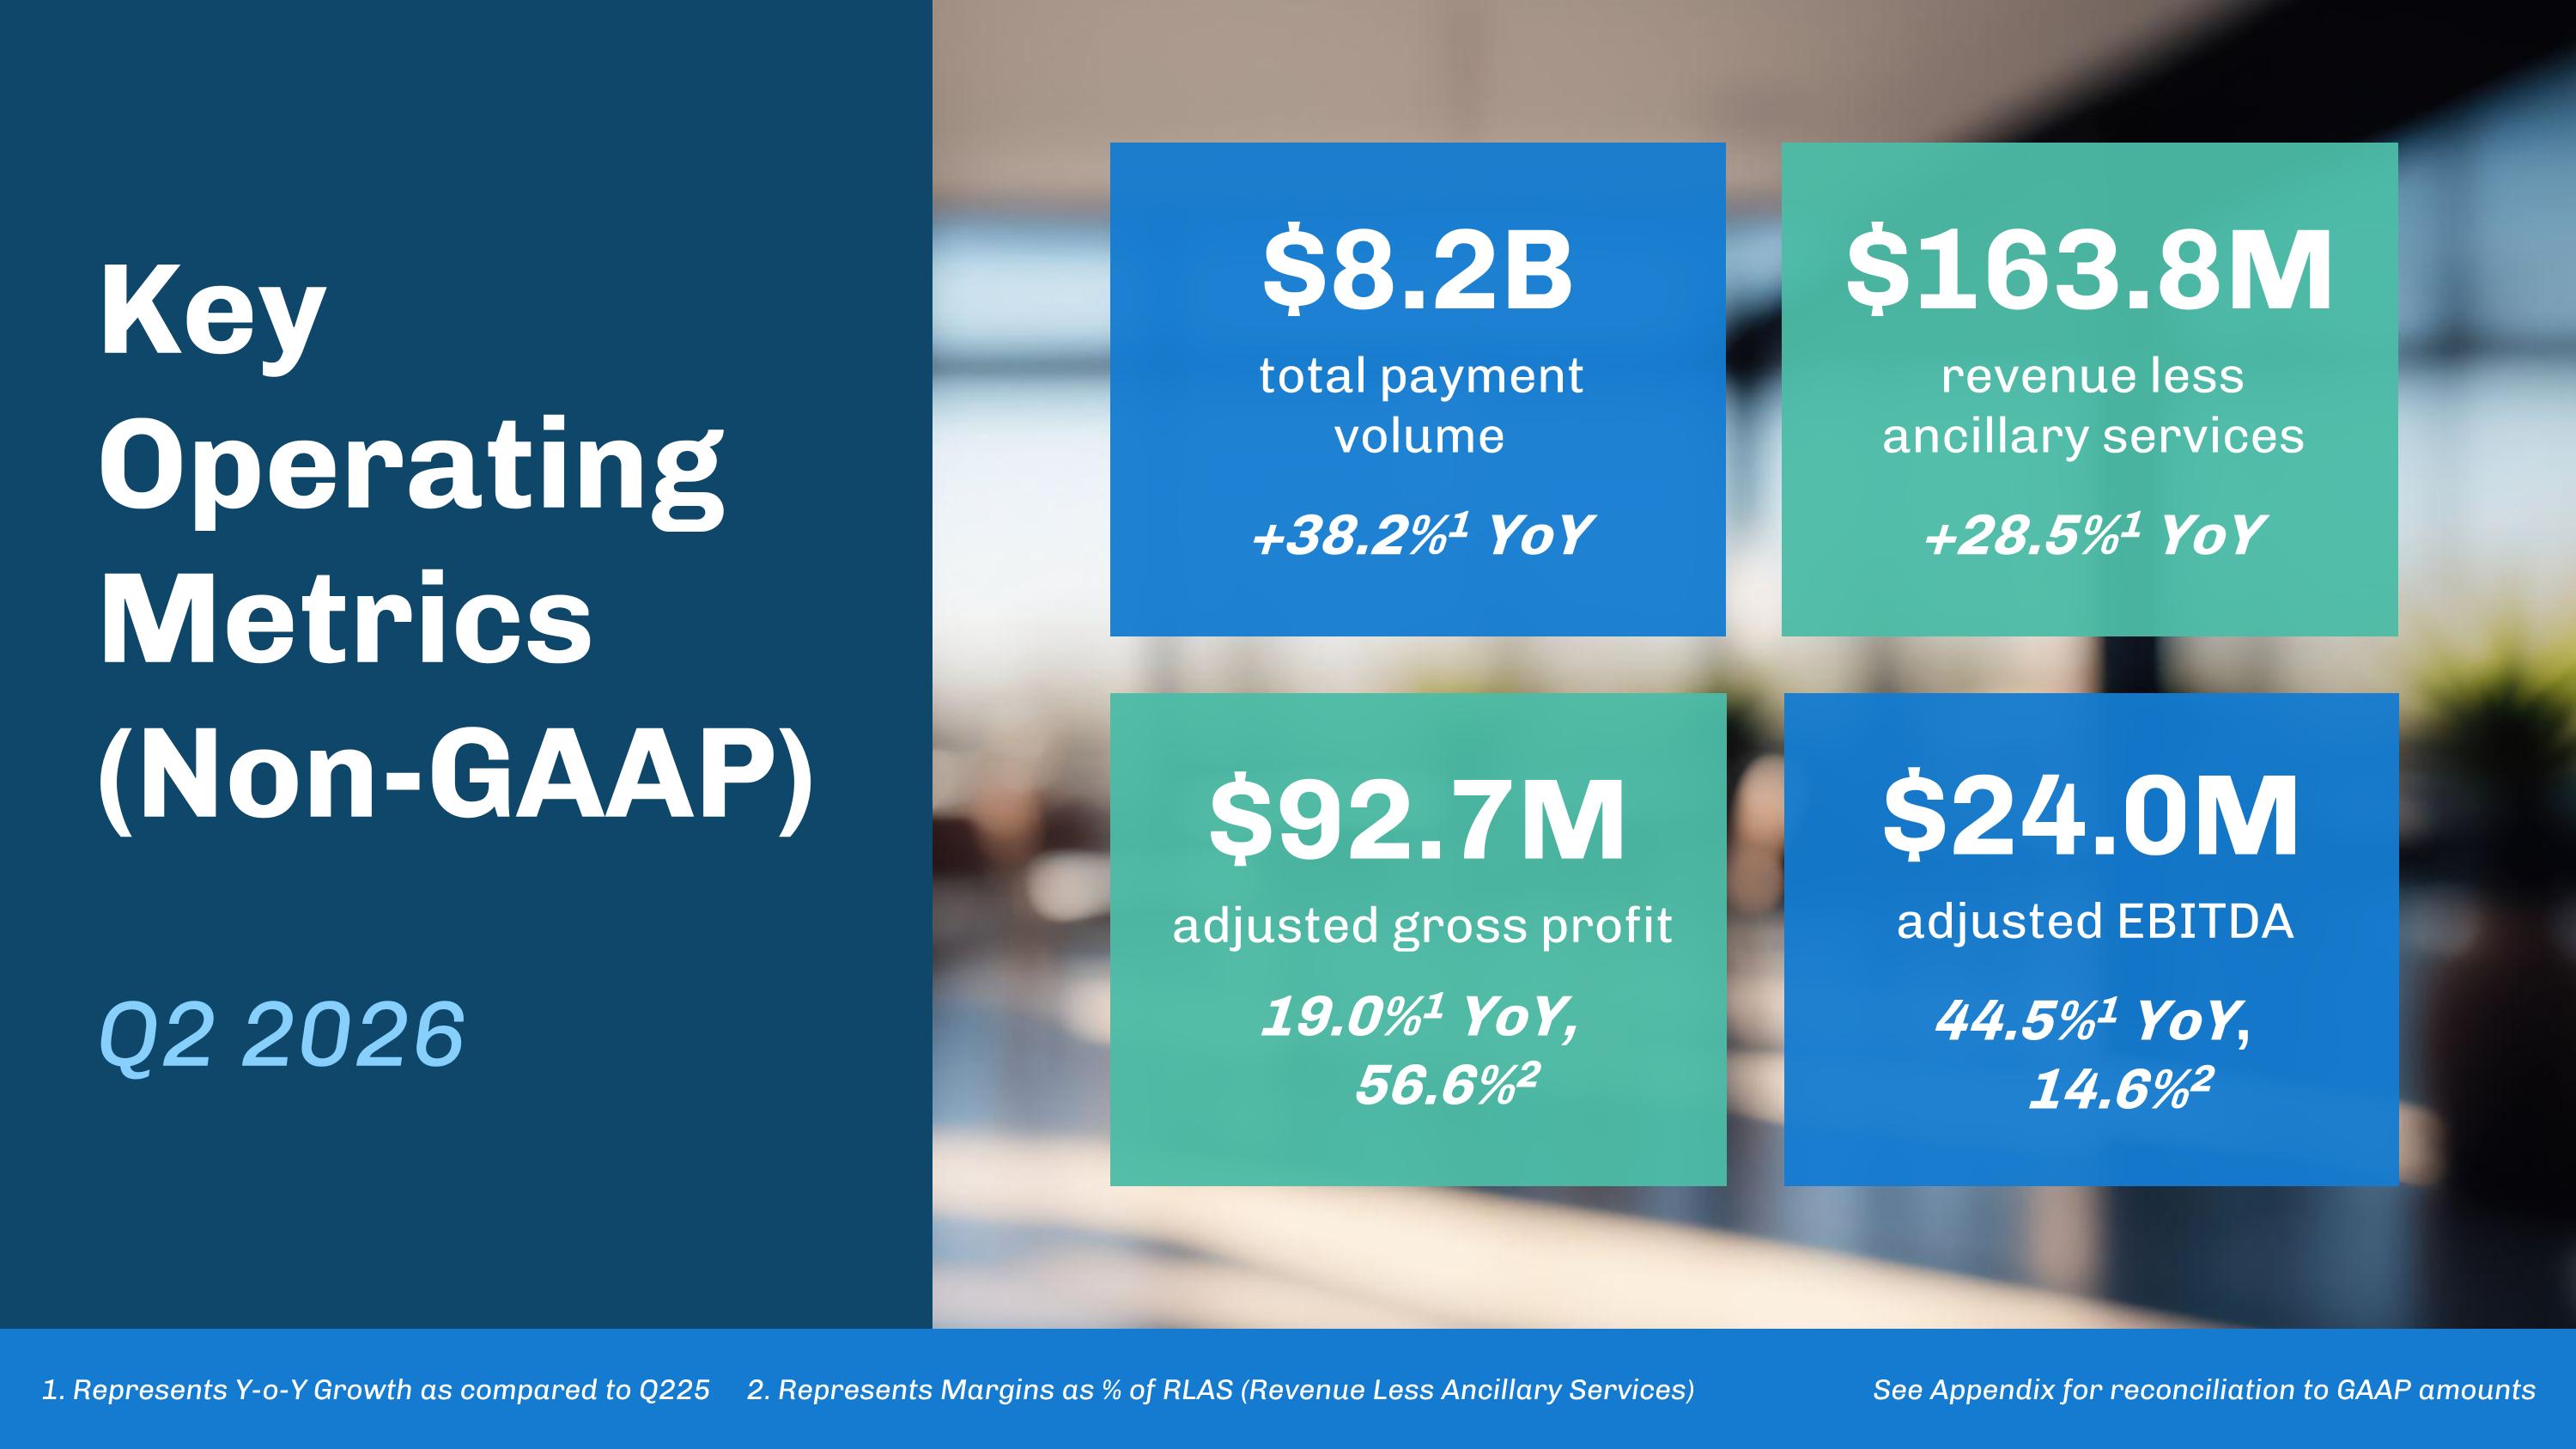
Key Operating Metrics (Non-GAAP)��Q2 2026 $8.2B total payment�volume��+38.2%1 YoY $92.7M adjusted gross profit��19.0%1 YoY, 56.6%2 $24.0M adjusted EBITDA��44.5%1 YoY, 14.6%2 $163.8M revenue less ancillary services��+28.5%1 YoY 1. Represents Y-o-Y Growth as compared to Q225 2. Represents Margins as % of RLAS (Revenue Less Ancillary Services) See Appendix for reconciliation to GAAP amounts
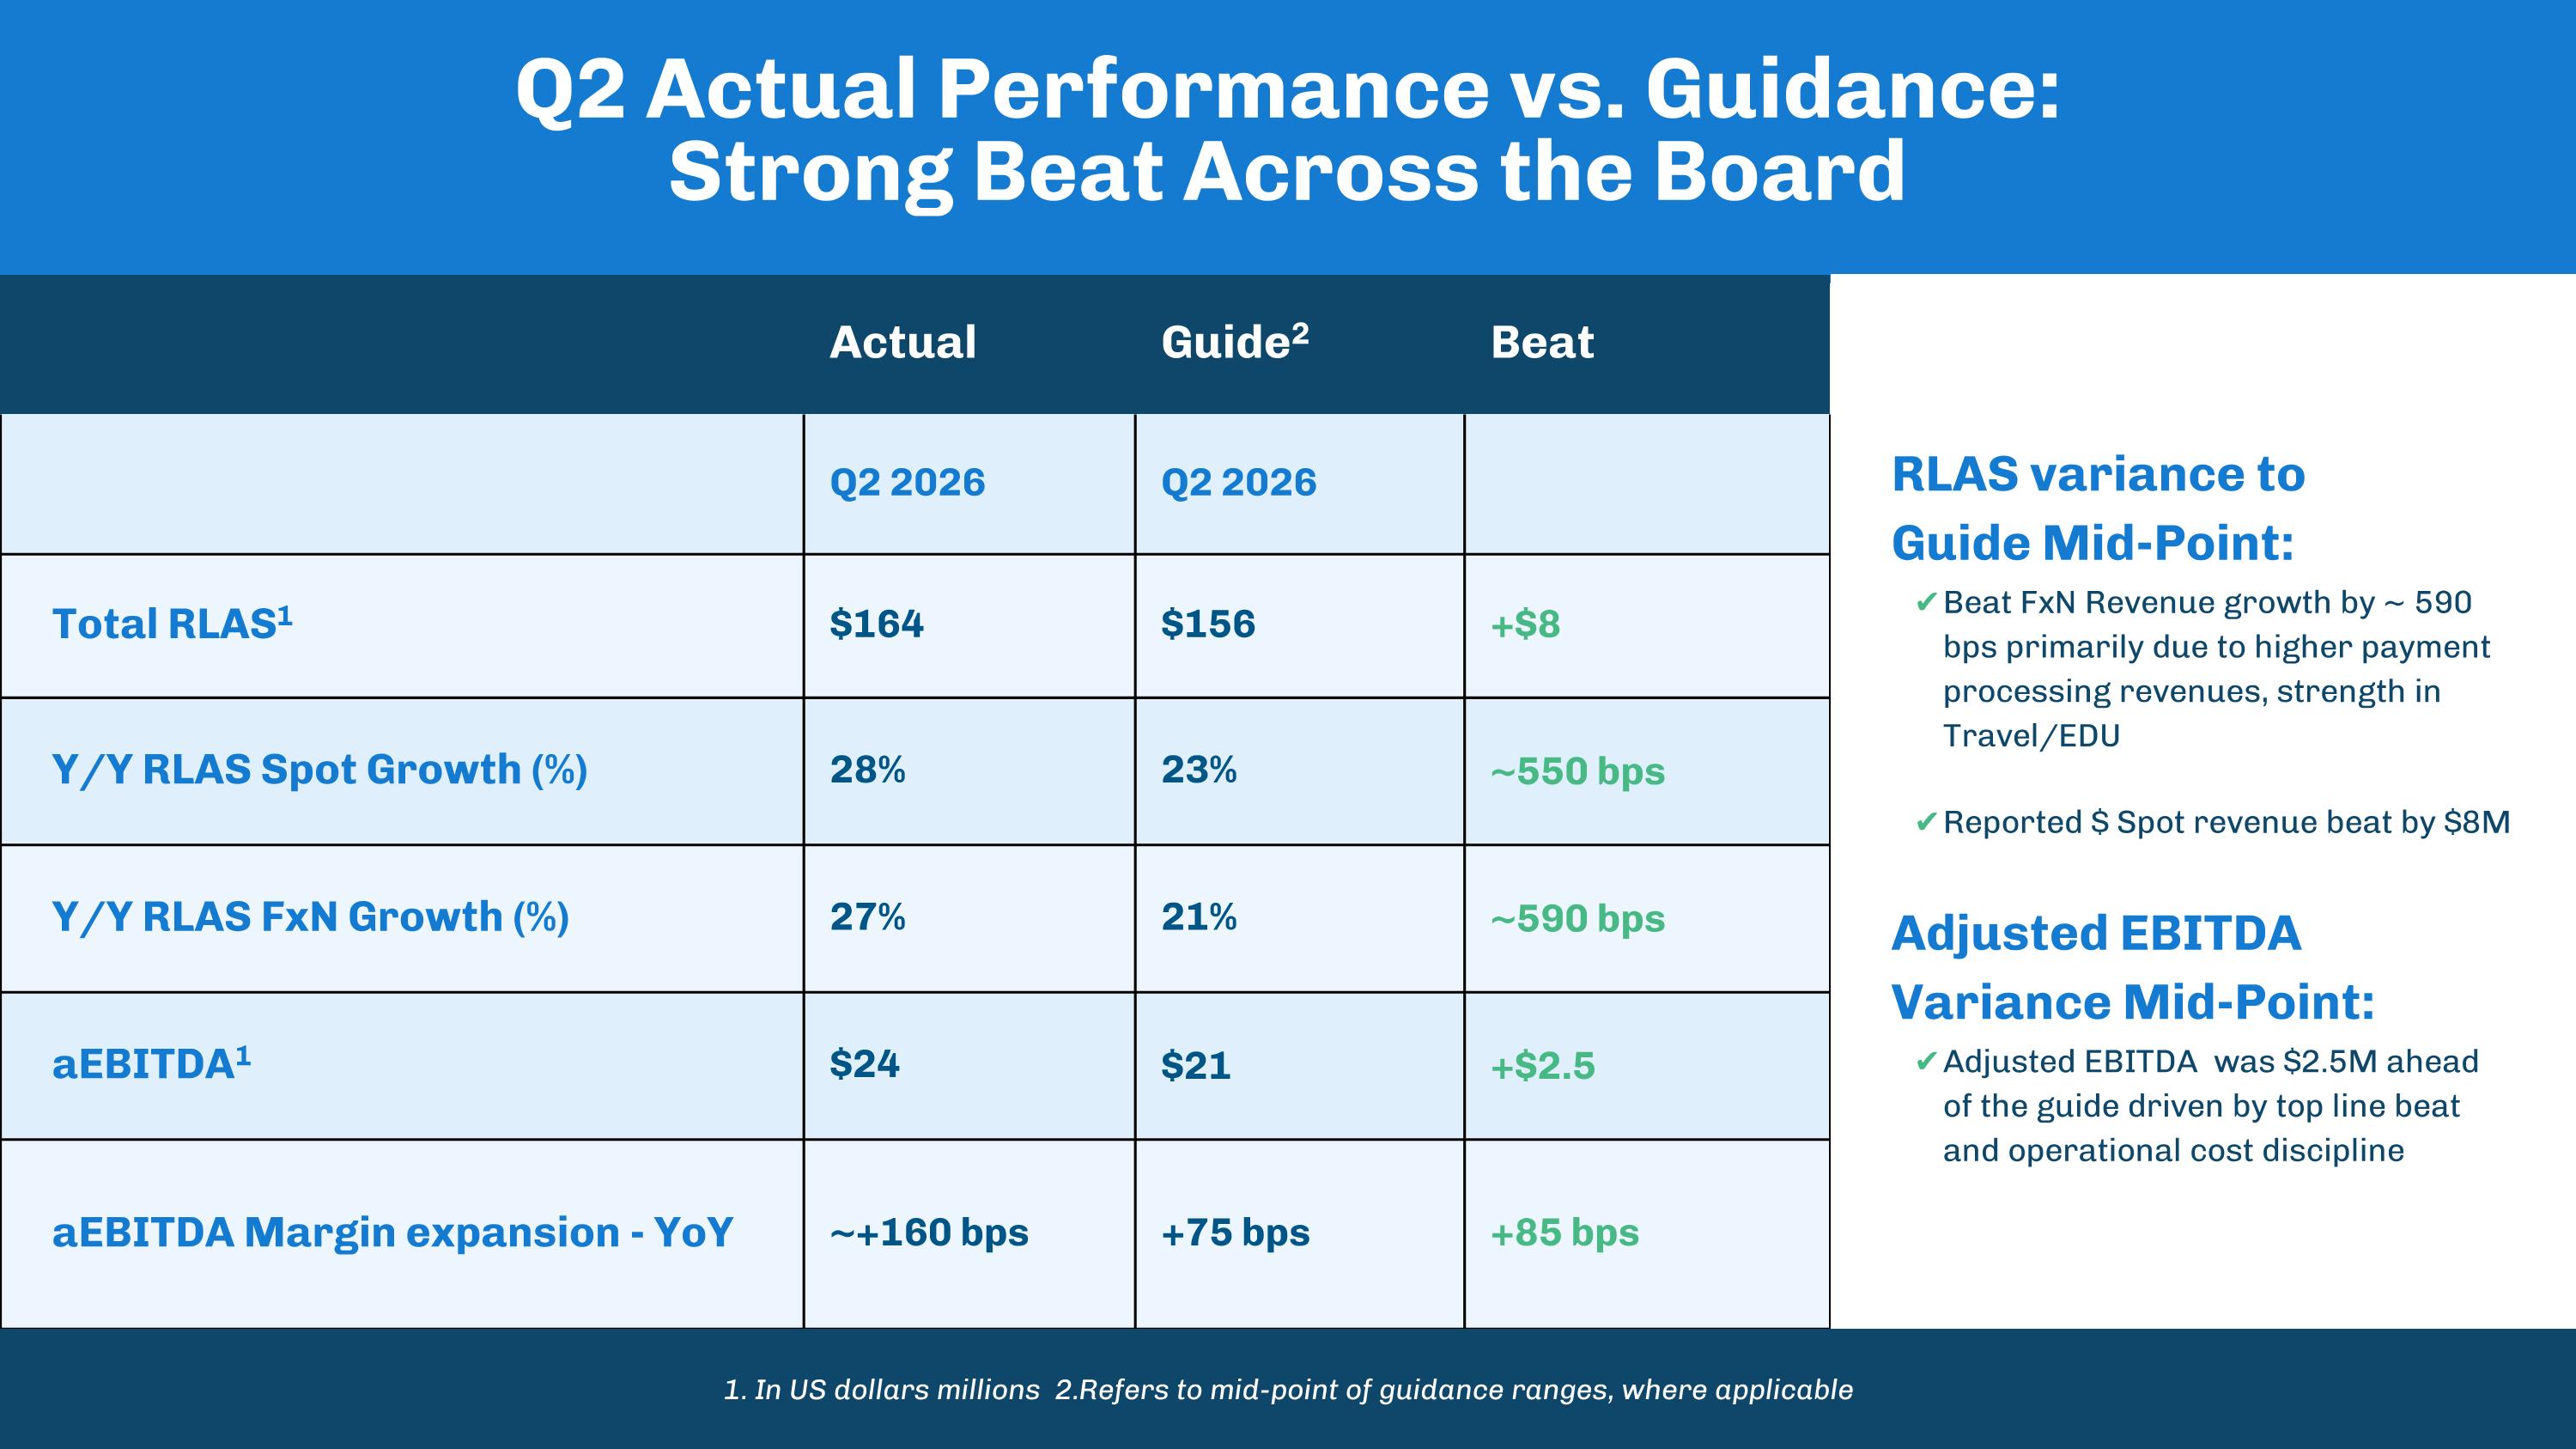
Q2 Actual Performance vs. Guidance: Strong Beat Across the Board Actual Guide2 Beat Q2 2026 Q2 2026 Total RLAS1 $164 $156 +$8 Y/Y RLAS Spot Growth (%) 28% 23% ~550 bps Y/Y RLAS FxN Growth (%) 27% 21% ~590 bps aEBITDA1 $24 $21 +$2.5 aEBITDA Margin expansion - YoY ~+160 bps +75 bps +85 bps RLAS variance to�Guide Mid-Point: Beat FxN Revenue growth by ~ 590 bps primarily due to higher payment processing revenues, strength in Travel/EDU Reported $ Spot revenue beat by $8M Adjusted EBITDA Variance Mid-Point: Adjusted EBITDA was $2.5M ahead of the guide driven by top line beat and operational cost discipline 1. In US dollars millions 2.Refers to mid-point of guidance ranges, where applicable
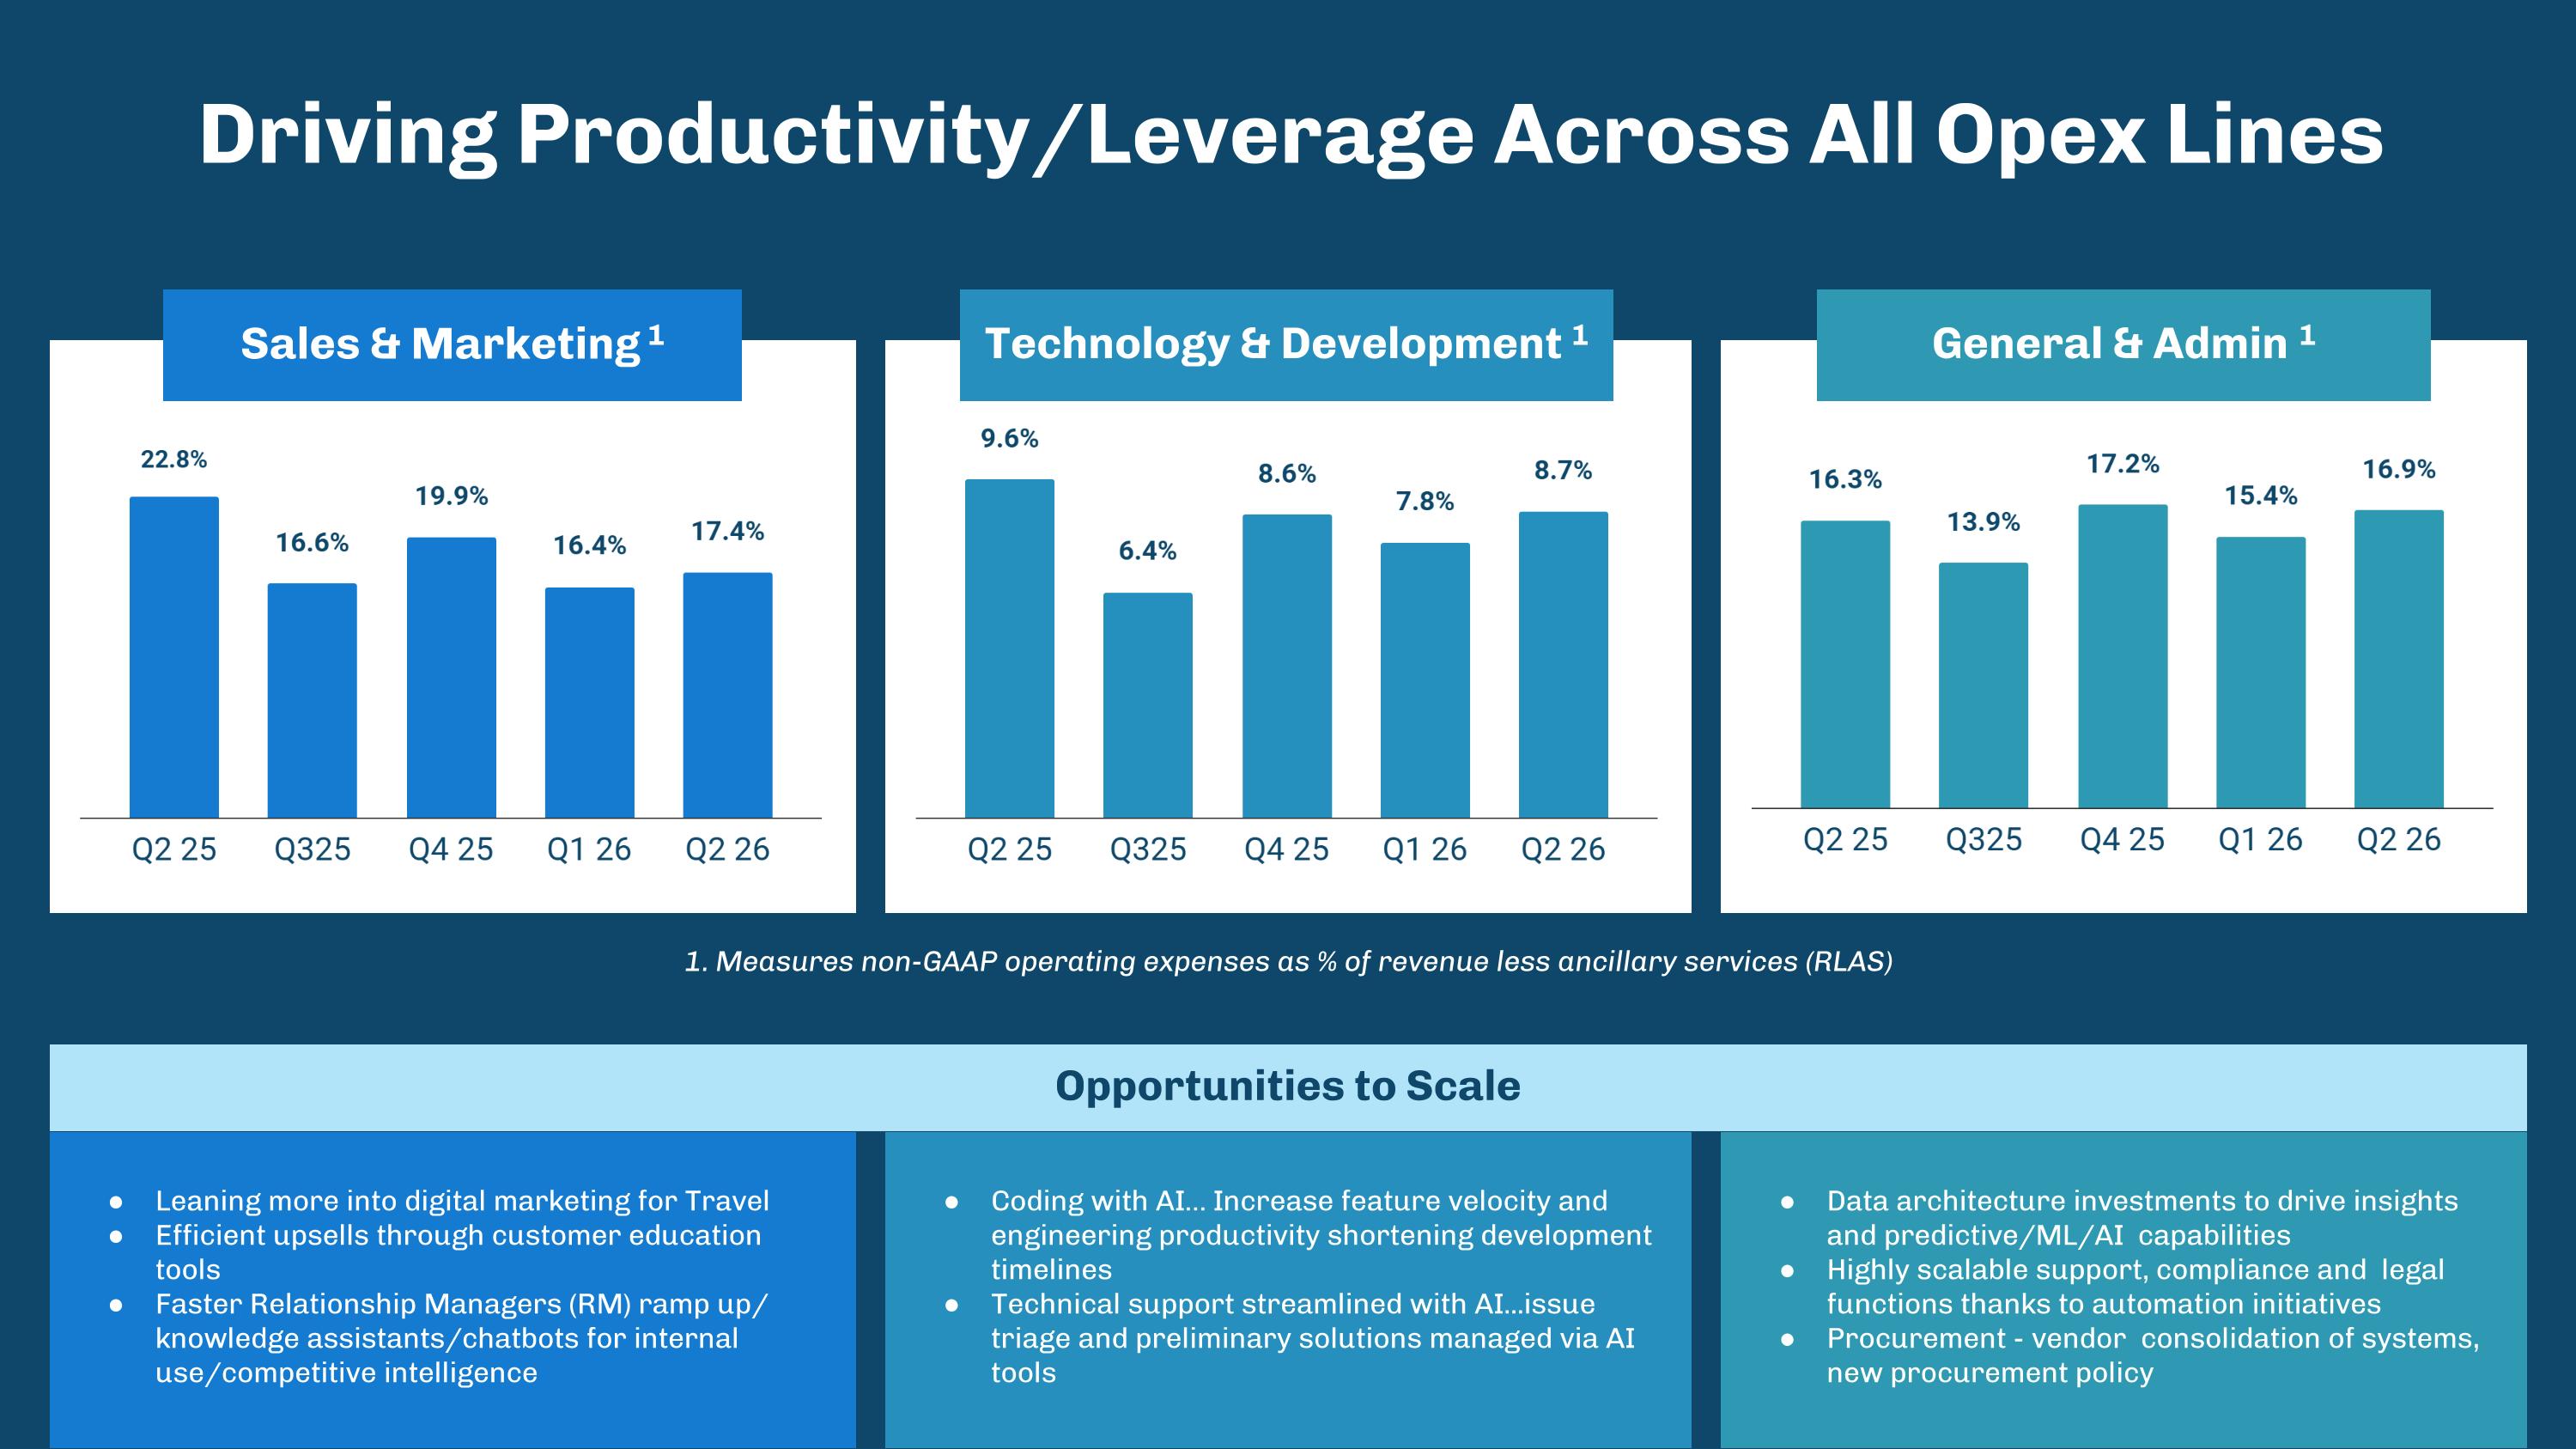
Coding with AI… Increase feature velocity and engineering productivity shortening development timelines Technical support streamlined with AI...issue triage and preliminary solutions managed via AI tools Data architecture investments to drive insights and predictive/ML/AI capabilities Highly scalable support, compliance and legal functions thanks to automation initiatives Procurement - vendor consolidation of systems, new procurement policy Leaning more into digital marketing for Travel Efficient upsells through customer education tools Faster Relationship Managers (RM) ramp up/ knowledge assistants/chatbots for internal use/competitive intelligence Driving Productivity/Leverage Across All Opex Lines Opportunities to Scale 1. Measures non-GAAP operating expenses as % of revenue less ancillary services (RLAS) Technology & Development 1 General & Admin 1 Sales & Marketing 1

Selected Customer Wins: Q2 2026 Strong New Client Wins & Expansion Across Existing Customers SIGNED SFS ACCOUNTS NEW LIVE ACCOUNTS & MAJOR EXPANSIONS Large Florida University Private Liberal Arts�University in Vermont

2026 & Q3 Financial Outlook
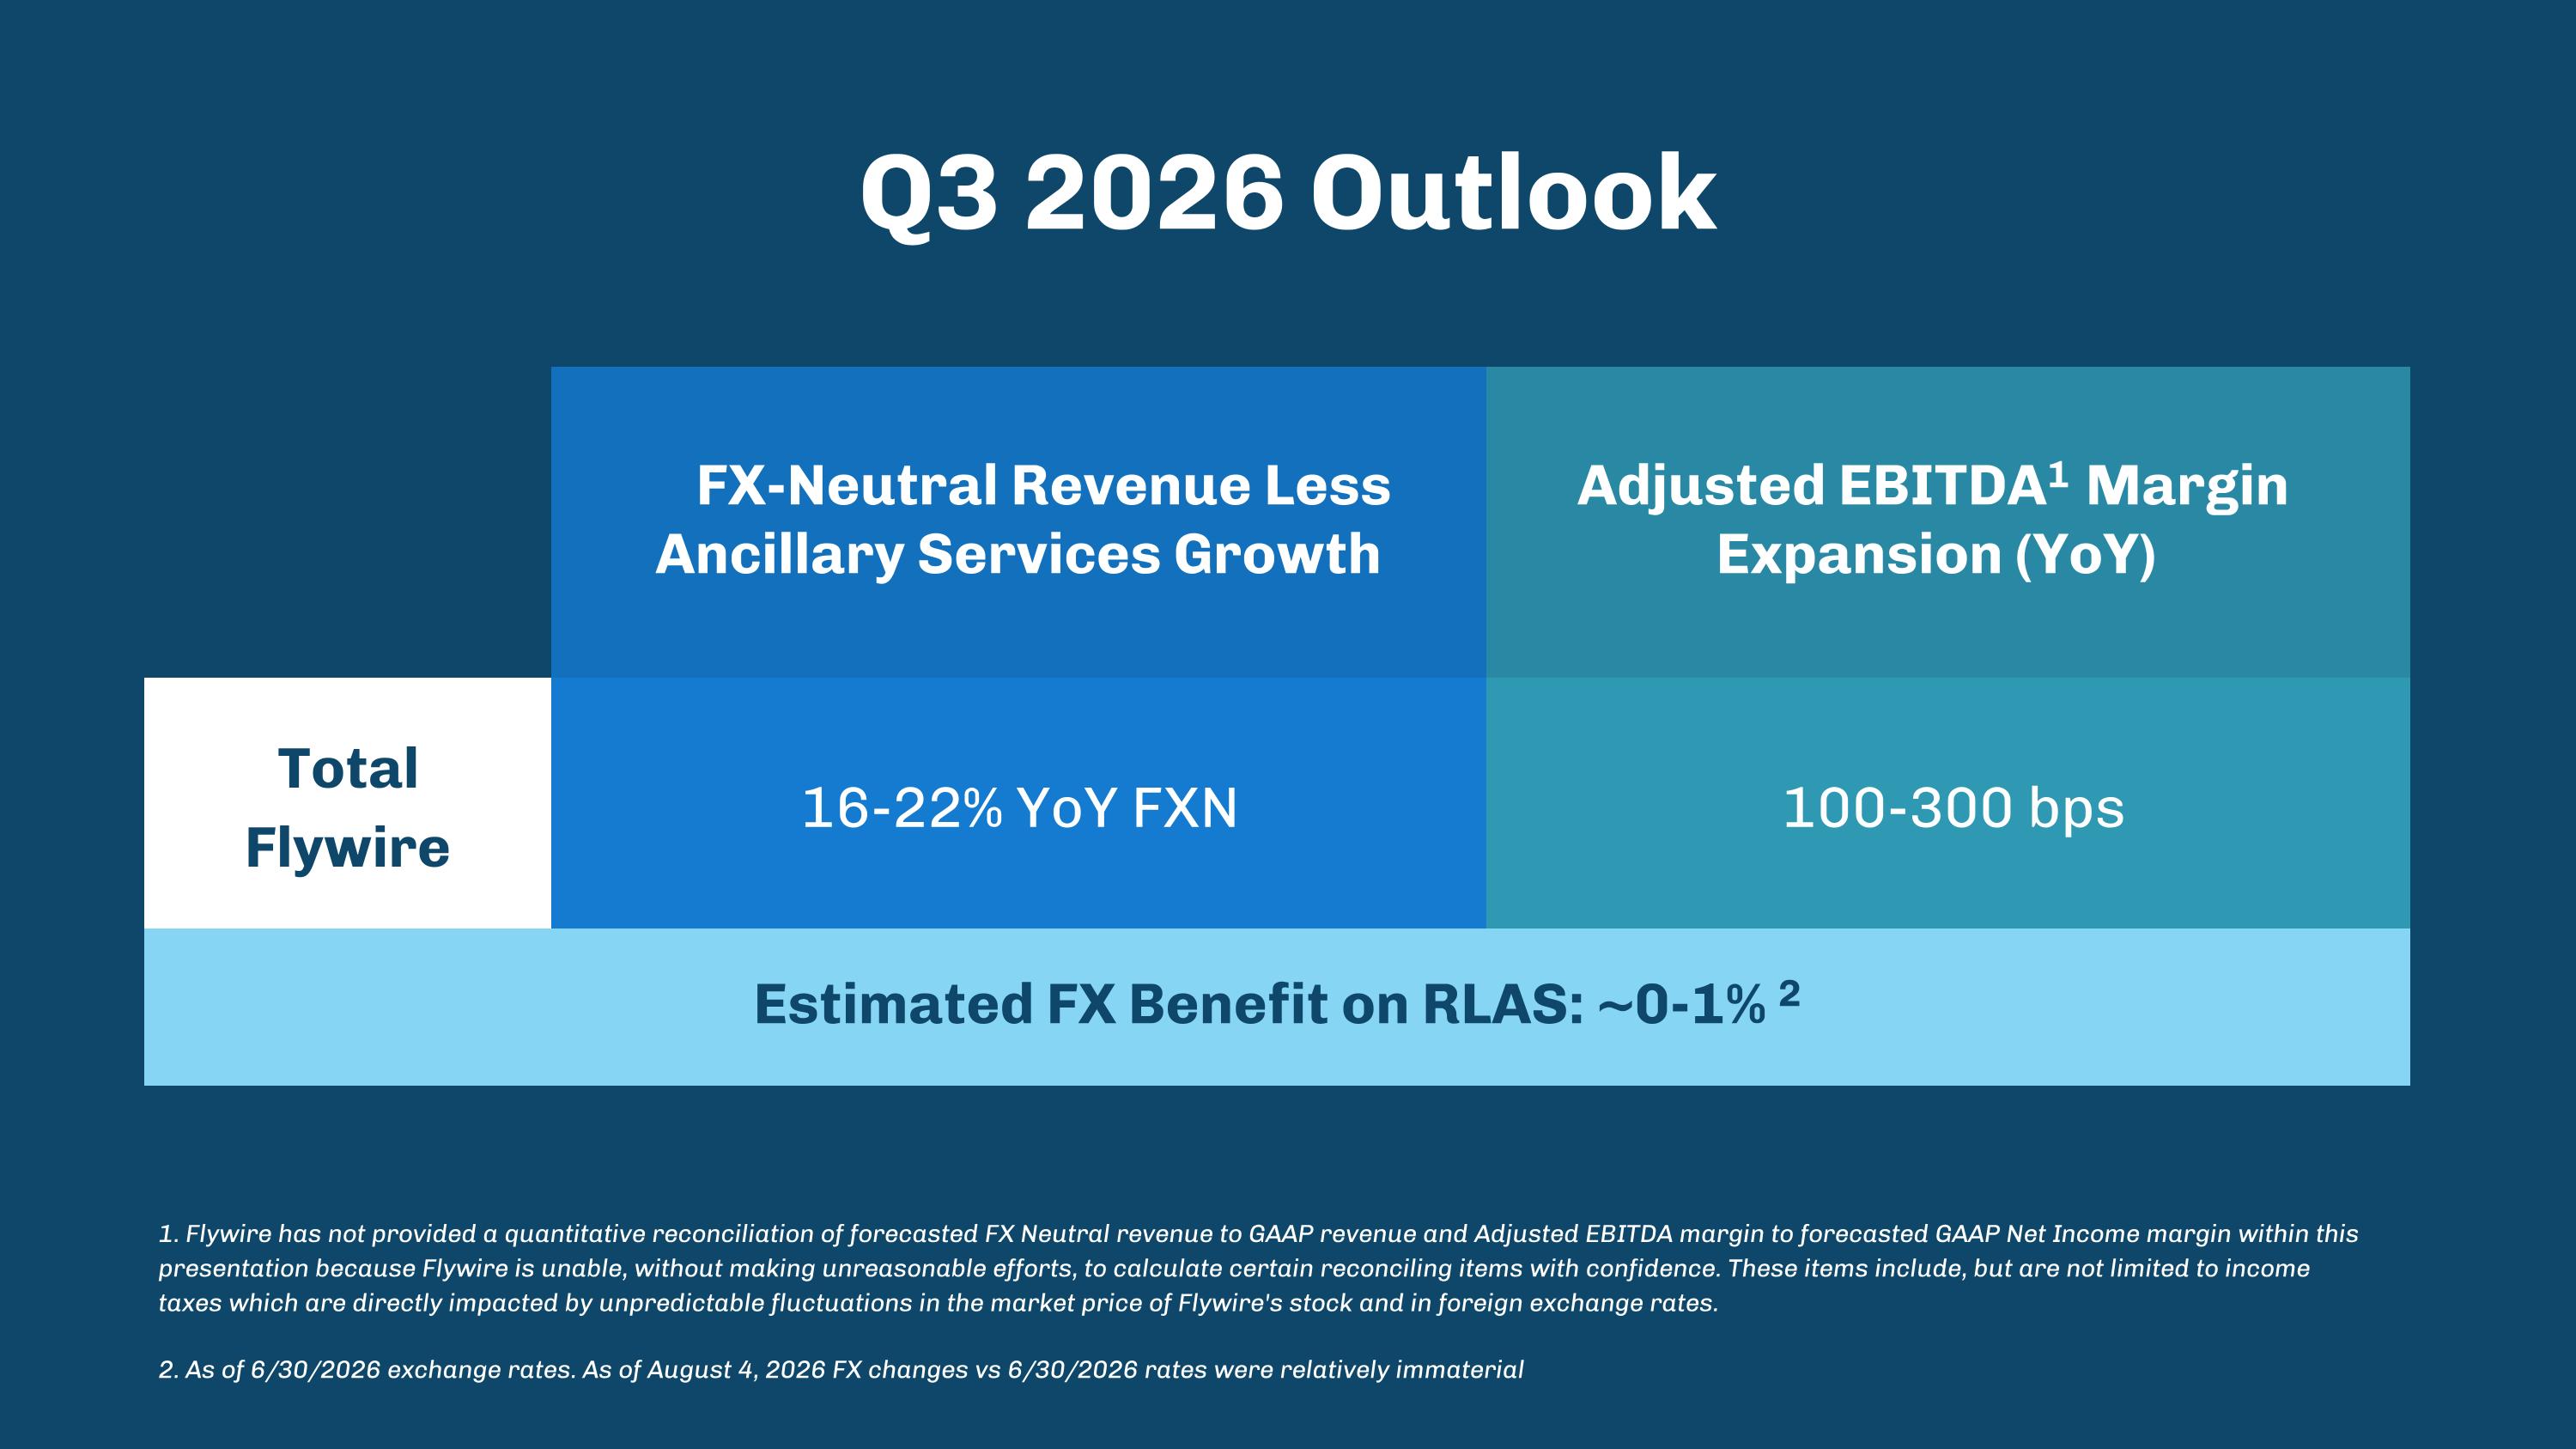
Q3 2026 Outlook 1. Flywire has not provided a quantitative reconciliation of forecasted FX Neutral revenue to GAAP revenue and Adjusted EBITDA margin to forecasted GAAP Net Income margin within this presentation because Flywire is unable, without making unreasonable efforts, to calculate certain reconciling items with confidence. These items include, but are not limited to income taxes which are directly impacted by unpredictable fluctuations in the market price of Flywire's stock and in foreign exchange rates. 2. As of 6/30/2026 exchange rates. As of August 4, 2026 FX changes vs 6/30/2026 rates were relatively immaterial FX-Neutral Revenue Less Ancillary Services Growth Adjusted EBITDA1 Margin Expansion (YoY) Total Flywire 16-22% YoY FXN 100-300 bps Estimated FX Benefit on RLAS: ~0-1% 2
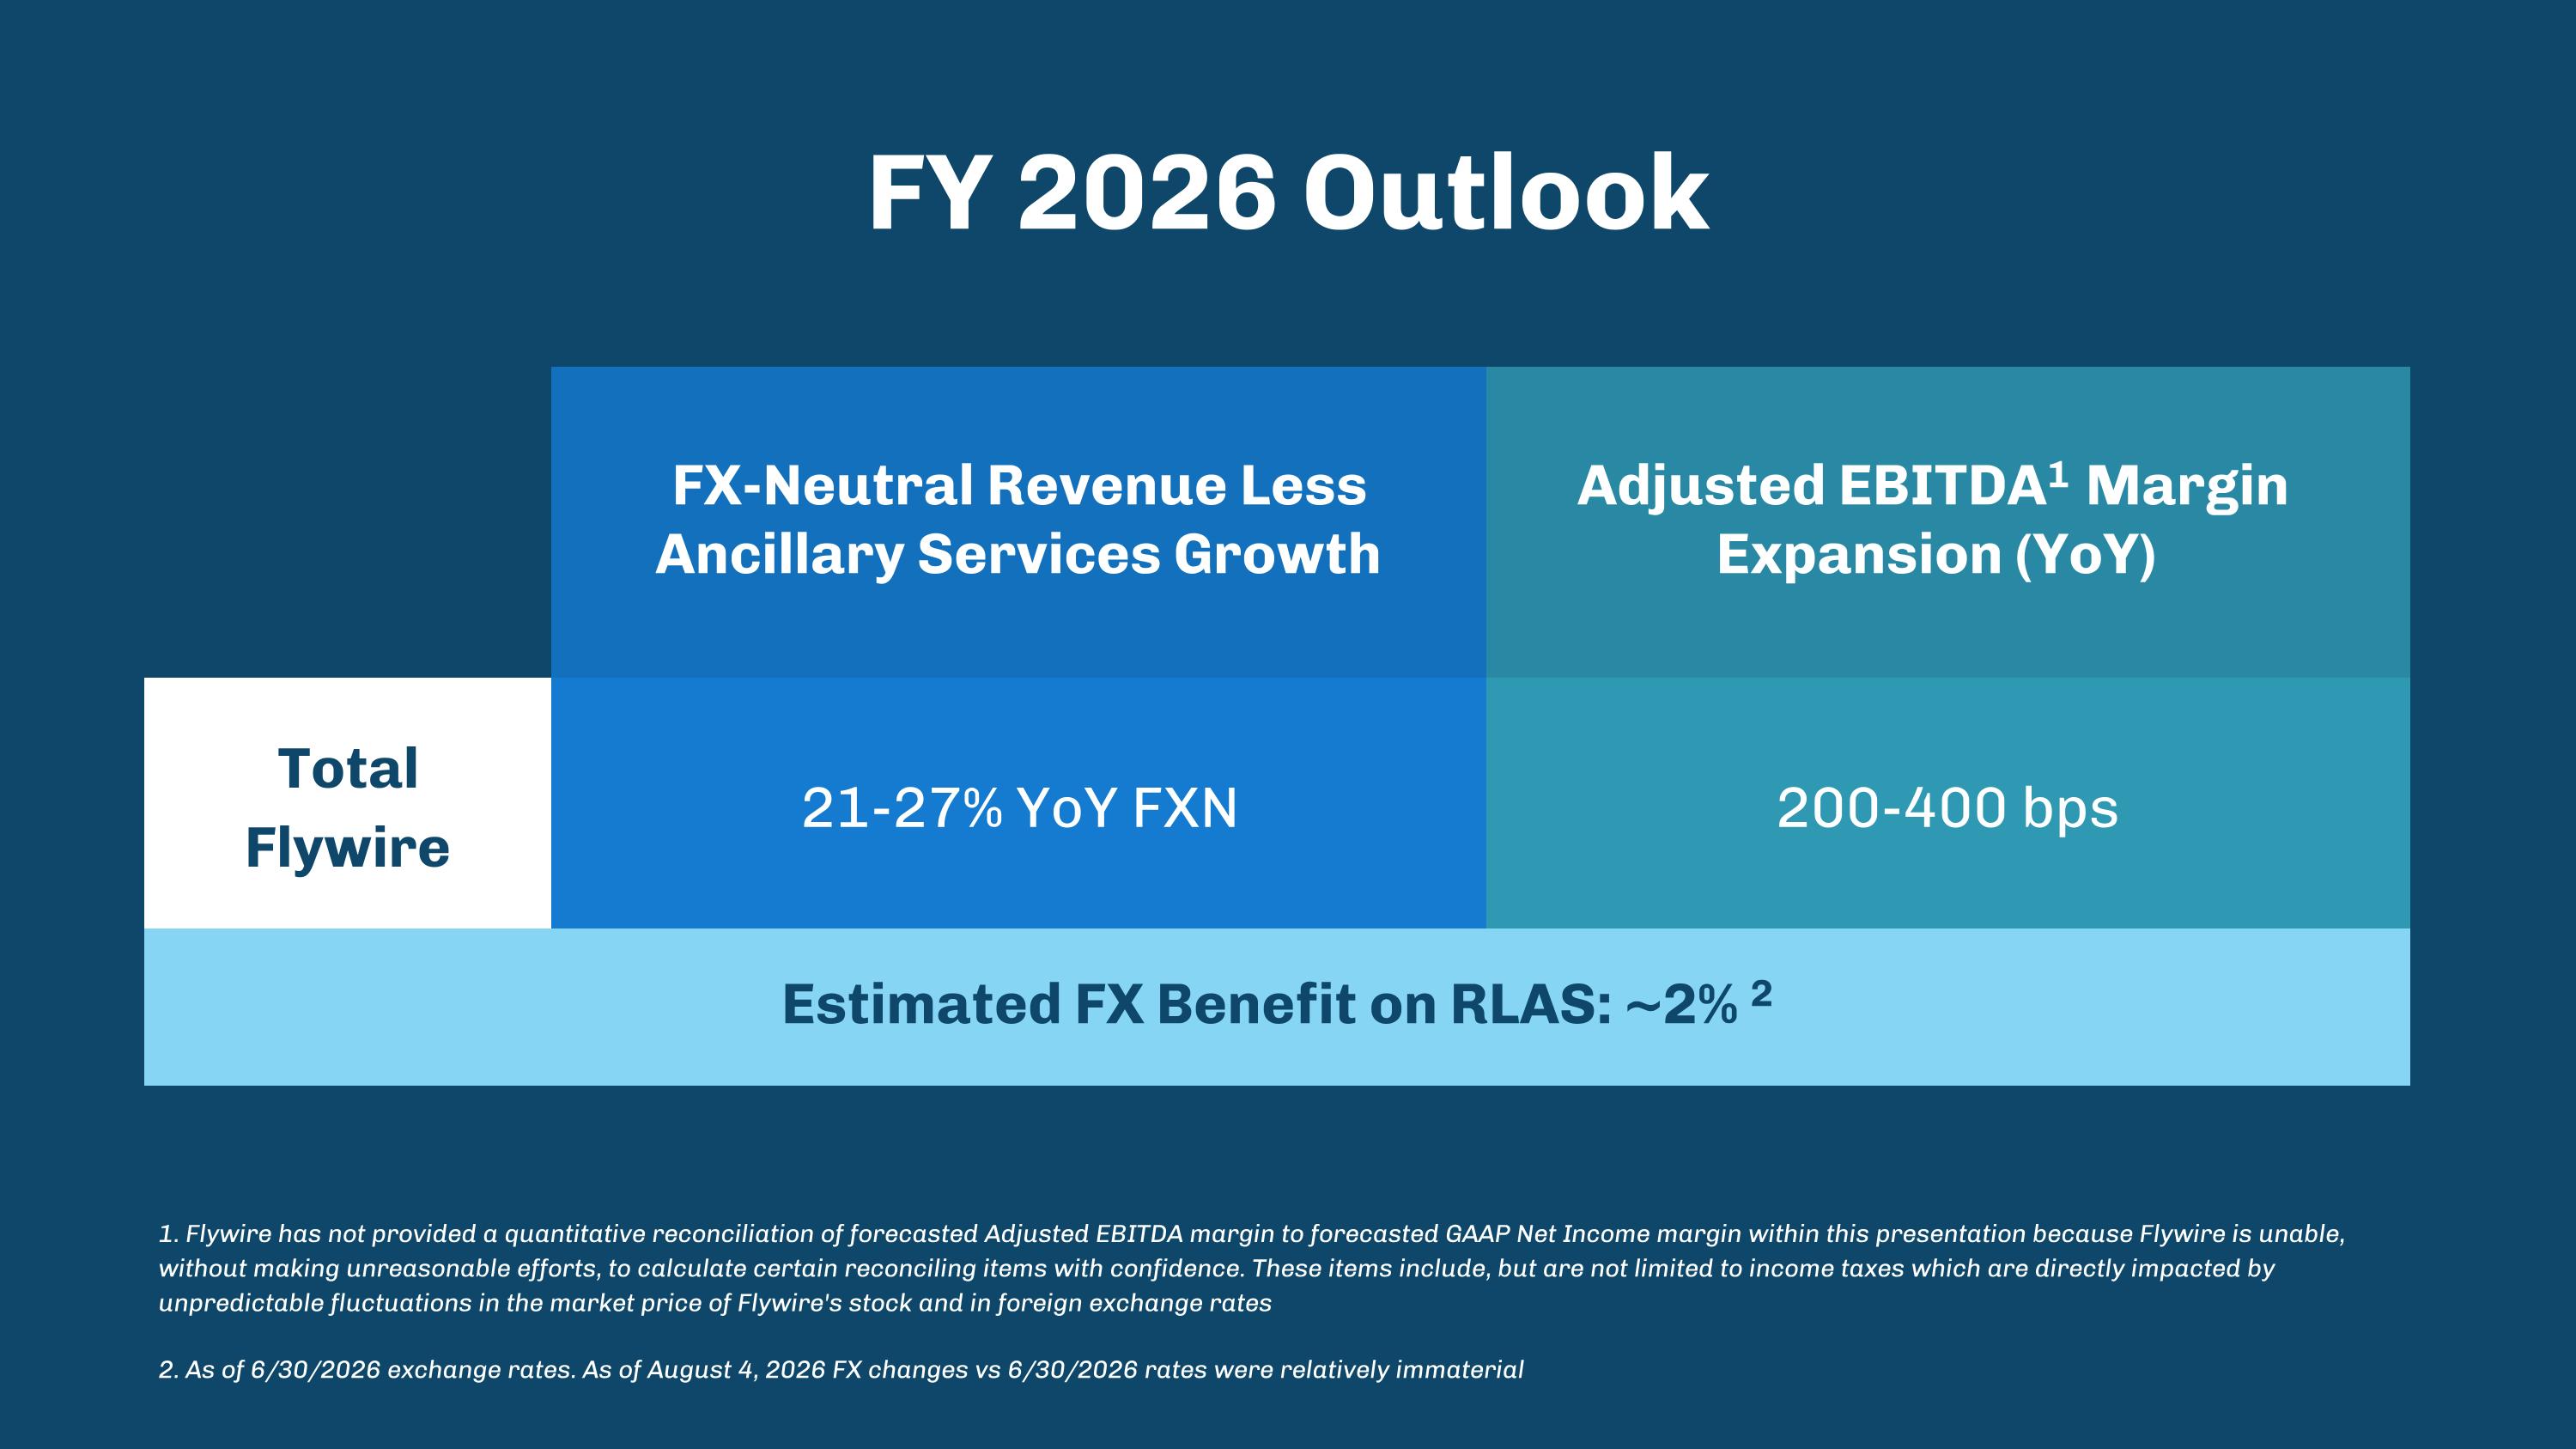
FY 2026 Outlook 1. Flywire has not provided a quantitative reconciliation of forecasted Adjusted EBITDA margin to forecasted GAAP Net Income margin within this presentation because Flywire is unable, without making unreasonable efforts, to calculate certain reconciling items with confidence. These items include, but are not limited to income taxes which are directly impacted by unpredictable fluctuations in the market price of Flywire's stock and in foreign exchange rates 2. As of 6/30/2026 exchange rates. As of August 4, 2026 FX changes vs 6/30/2026 rates were relatively immaterial FX-Neutral Revenue Less Ancillary Services Growth Adjusted EBITDA1 Margin Expansion (YoY) Total Flywire 21-27% YoY FXN 200-400 bps Estimated FX Benefit on RLAS: ~2% 2
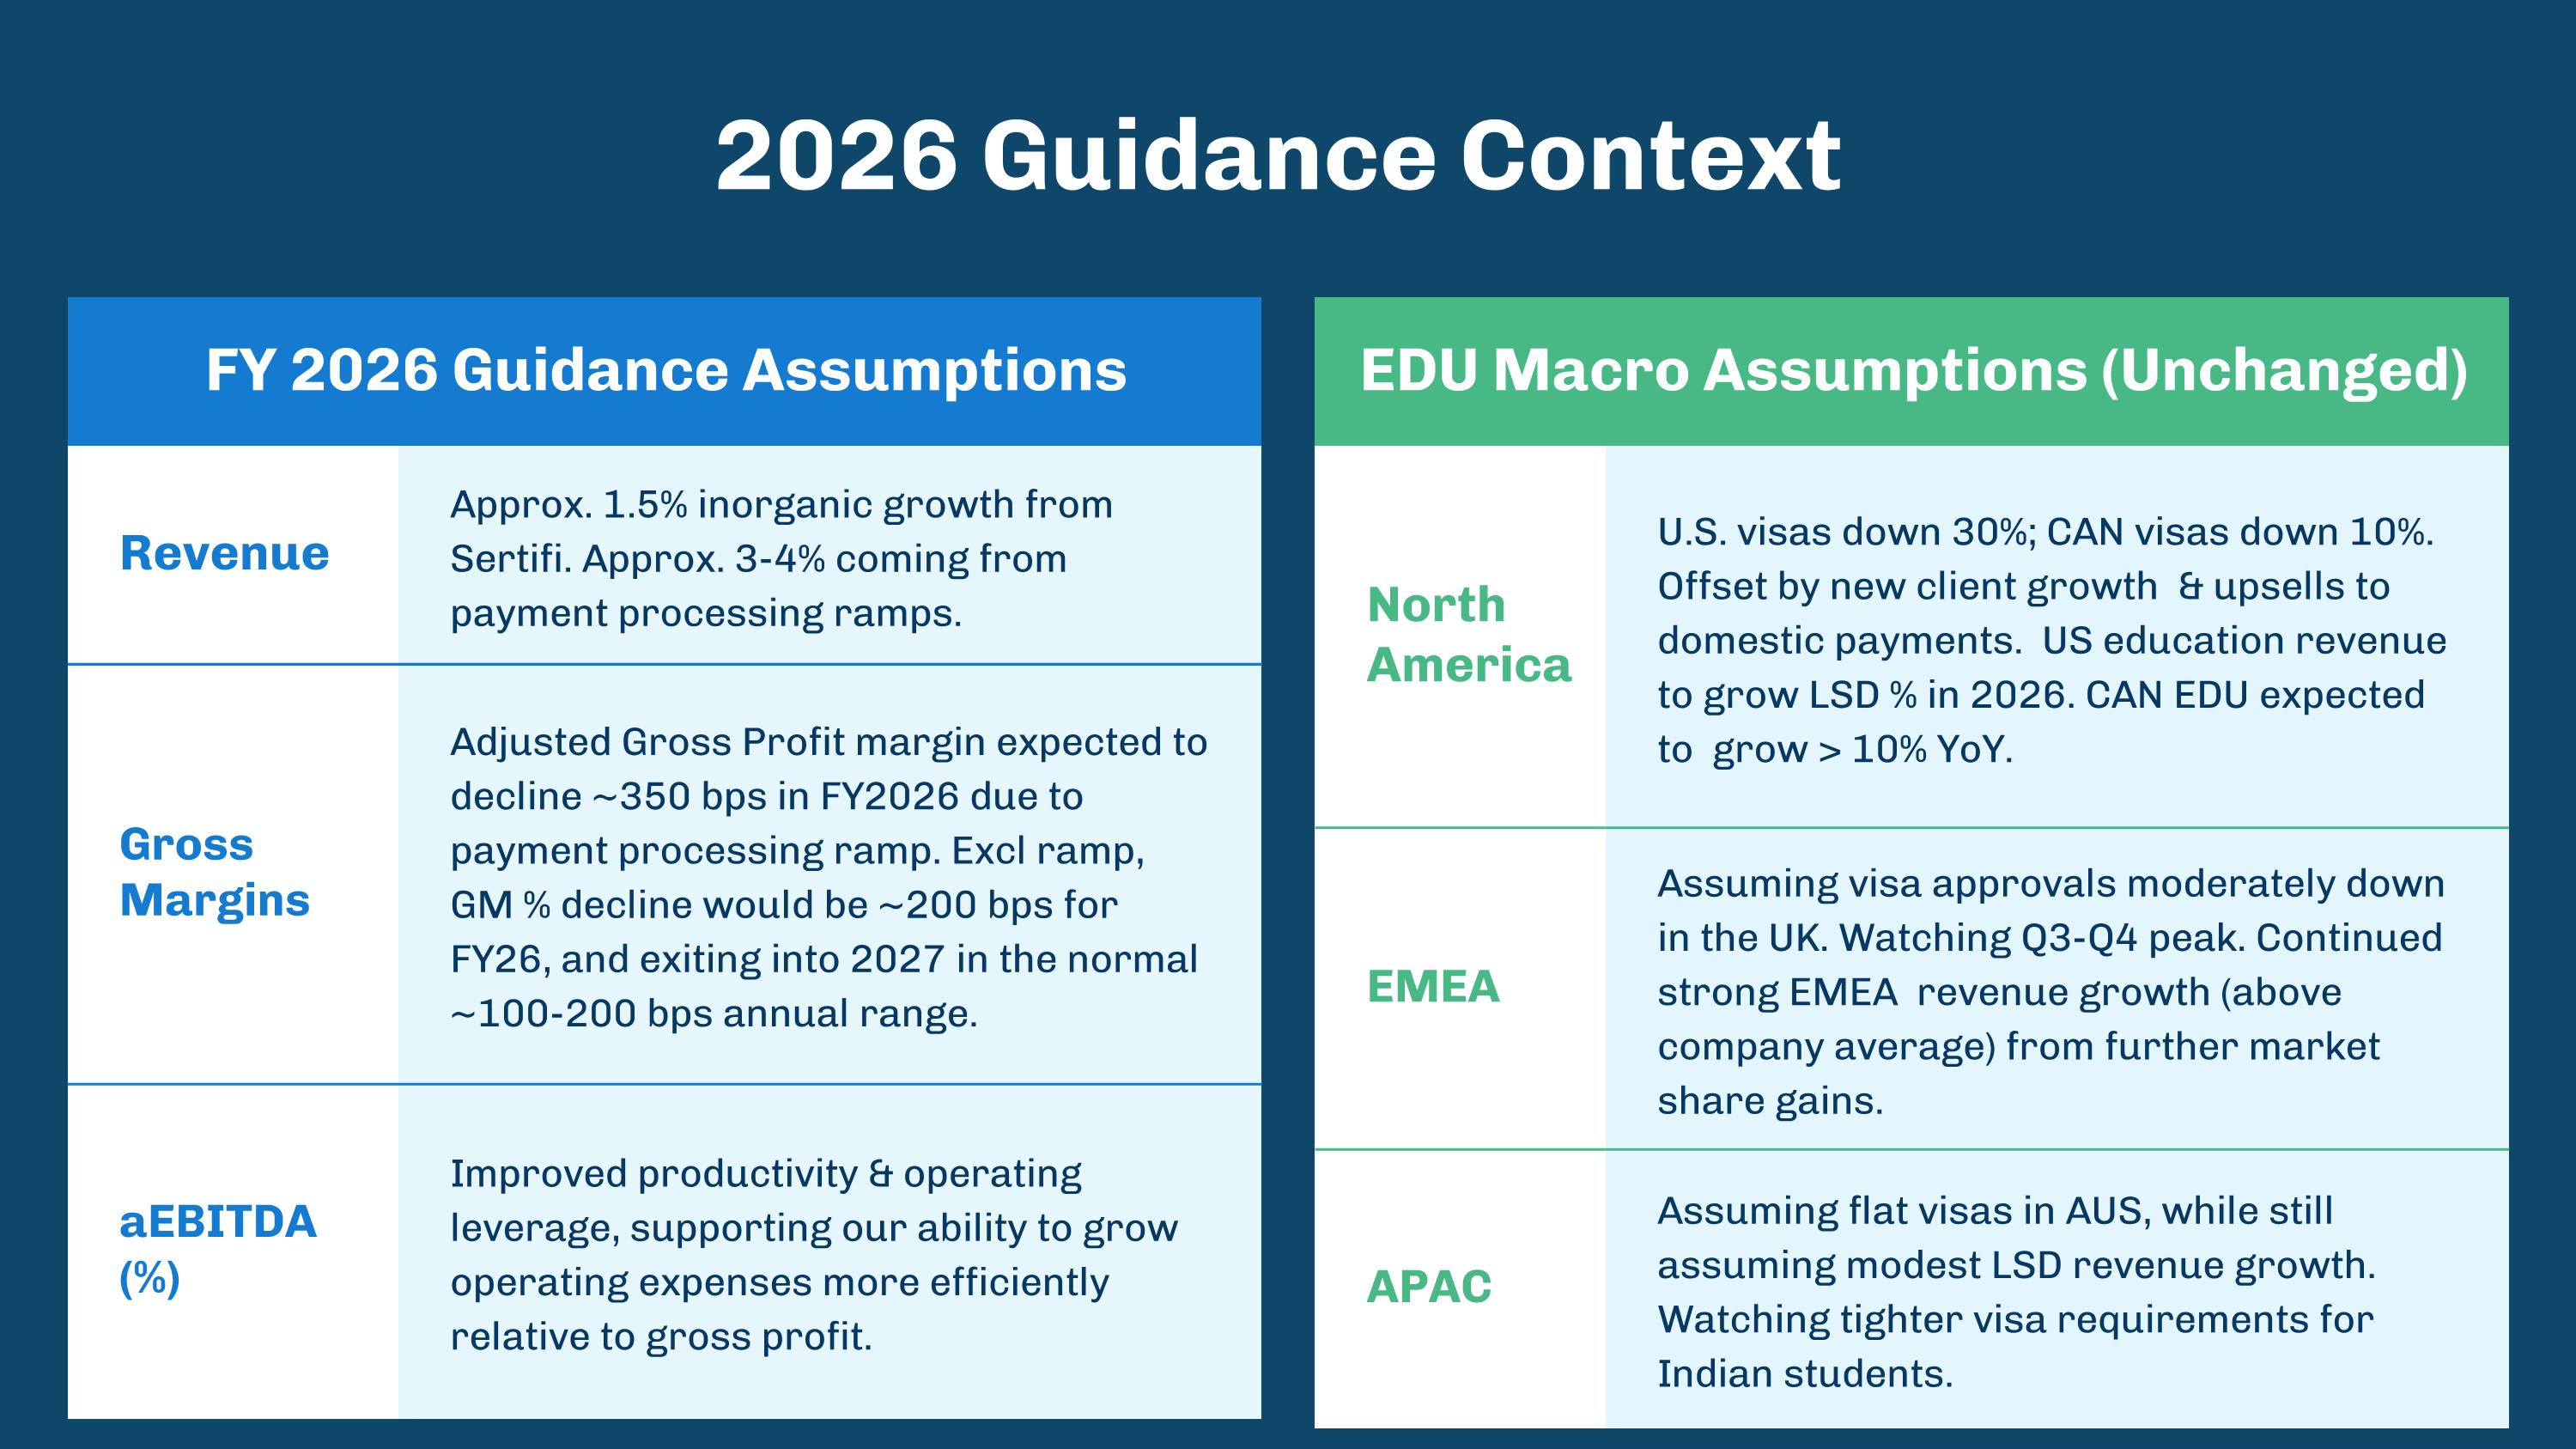
FY 2026 Guidance Assumptions EDU Macro Assumptions (Unchanged) Revenue Approx. 1.5% inorganic growth from Sertifi. Approx. 3-4% coming from payment processing ramps. Gross Margins Adjusted Gross Profit margin expected to decline ~350 bps in FY2026 due to payment processing ramp. Excl ramp, GM % decline would be ~200 bps for FY26, and exiting into 2027 in the normal ~100-200 bps annual range. aEBITDA (%) Improved productivity & operating leverage, supporting our ability to grow operating expenses more efficiently relative to gross profit. 2026 Guidance Context North America U.S. visas down 30%; CAN visas down 10%. Offset by new client growth & upsells to domestic payments. US education revenue to grow LSD % in 2026. CAN EDU expected to grow > 10% YoY. EMEA Assuming visa approvals moderately down in the UK. Watching Q3-Q4 peak. Continued strong EMEA revenue growth (above company average) from further market share gains. APAC Assuming flat visas in AUS, while still assuming modest LSD revenue growth. Watching tighter visa requirements for Indian students.
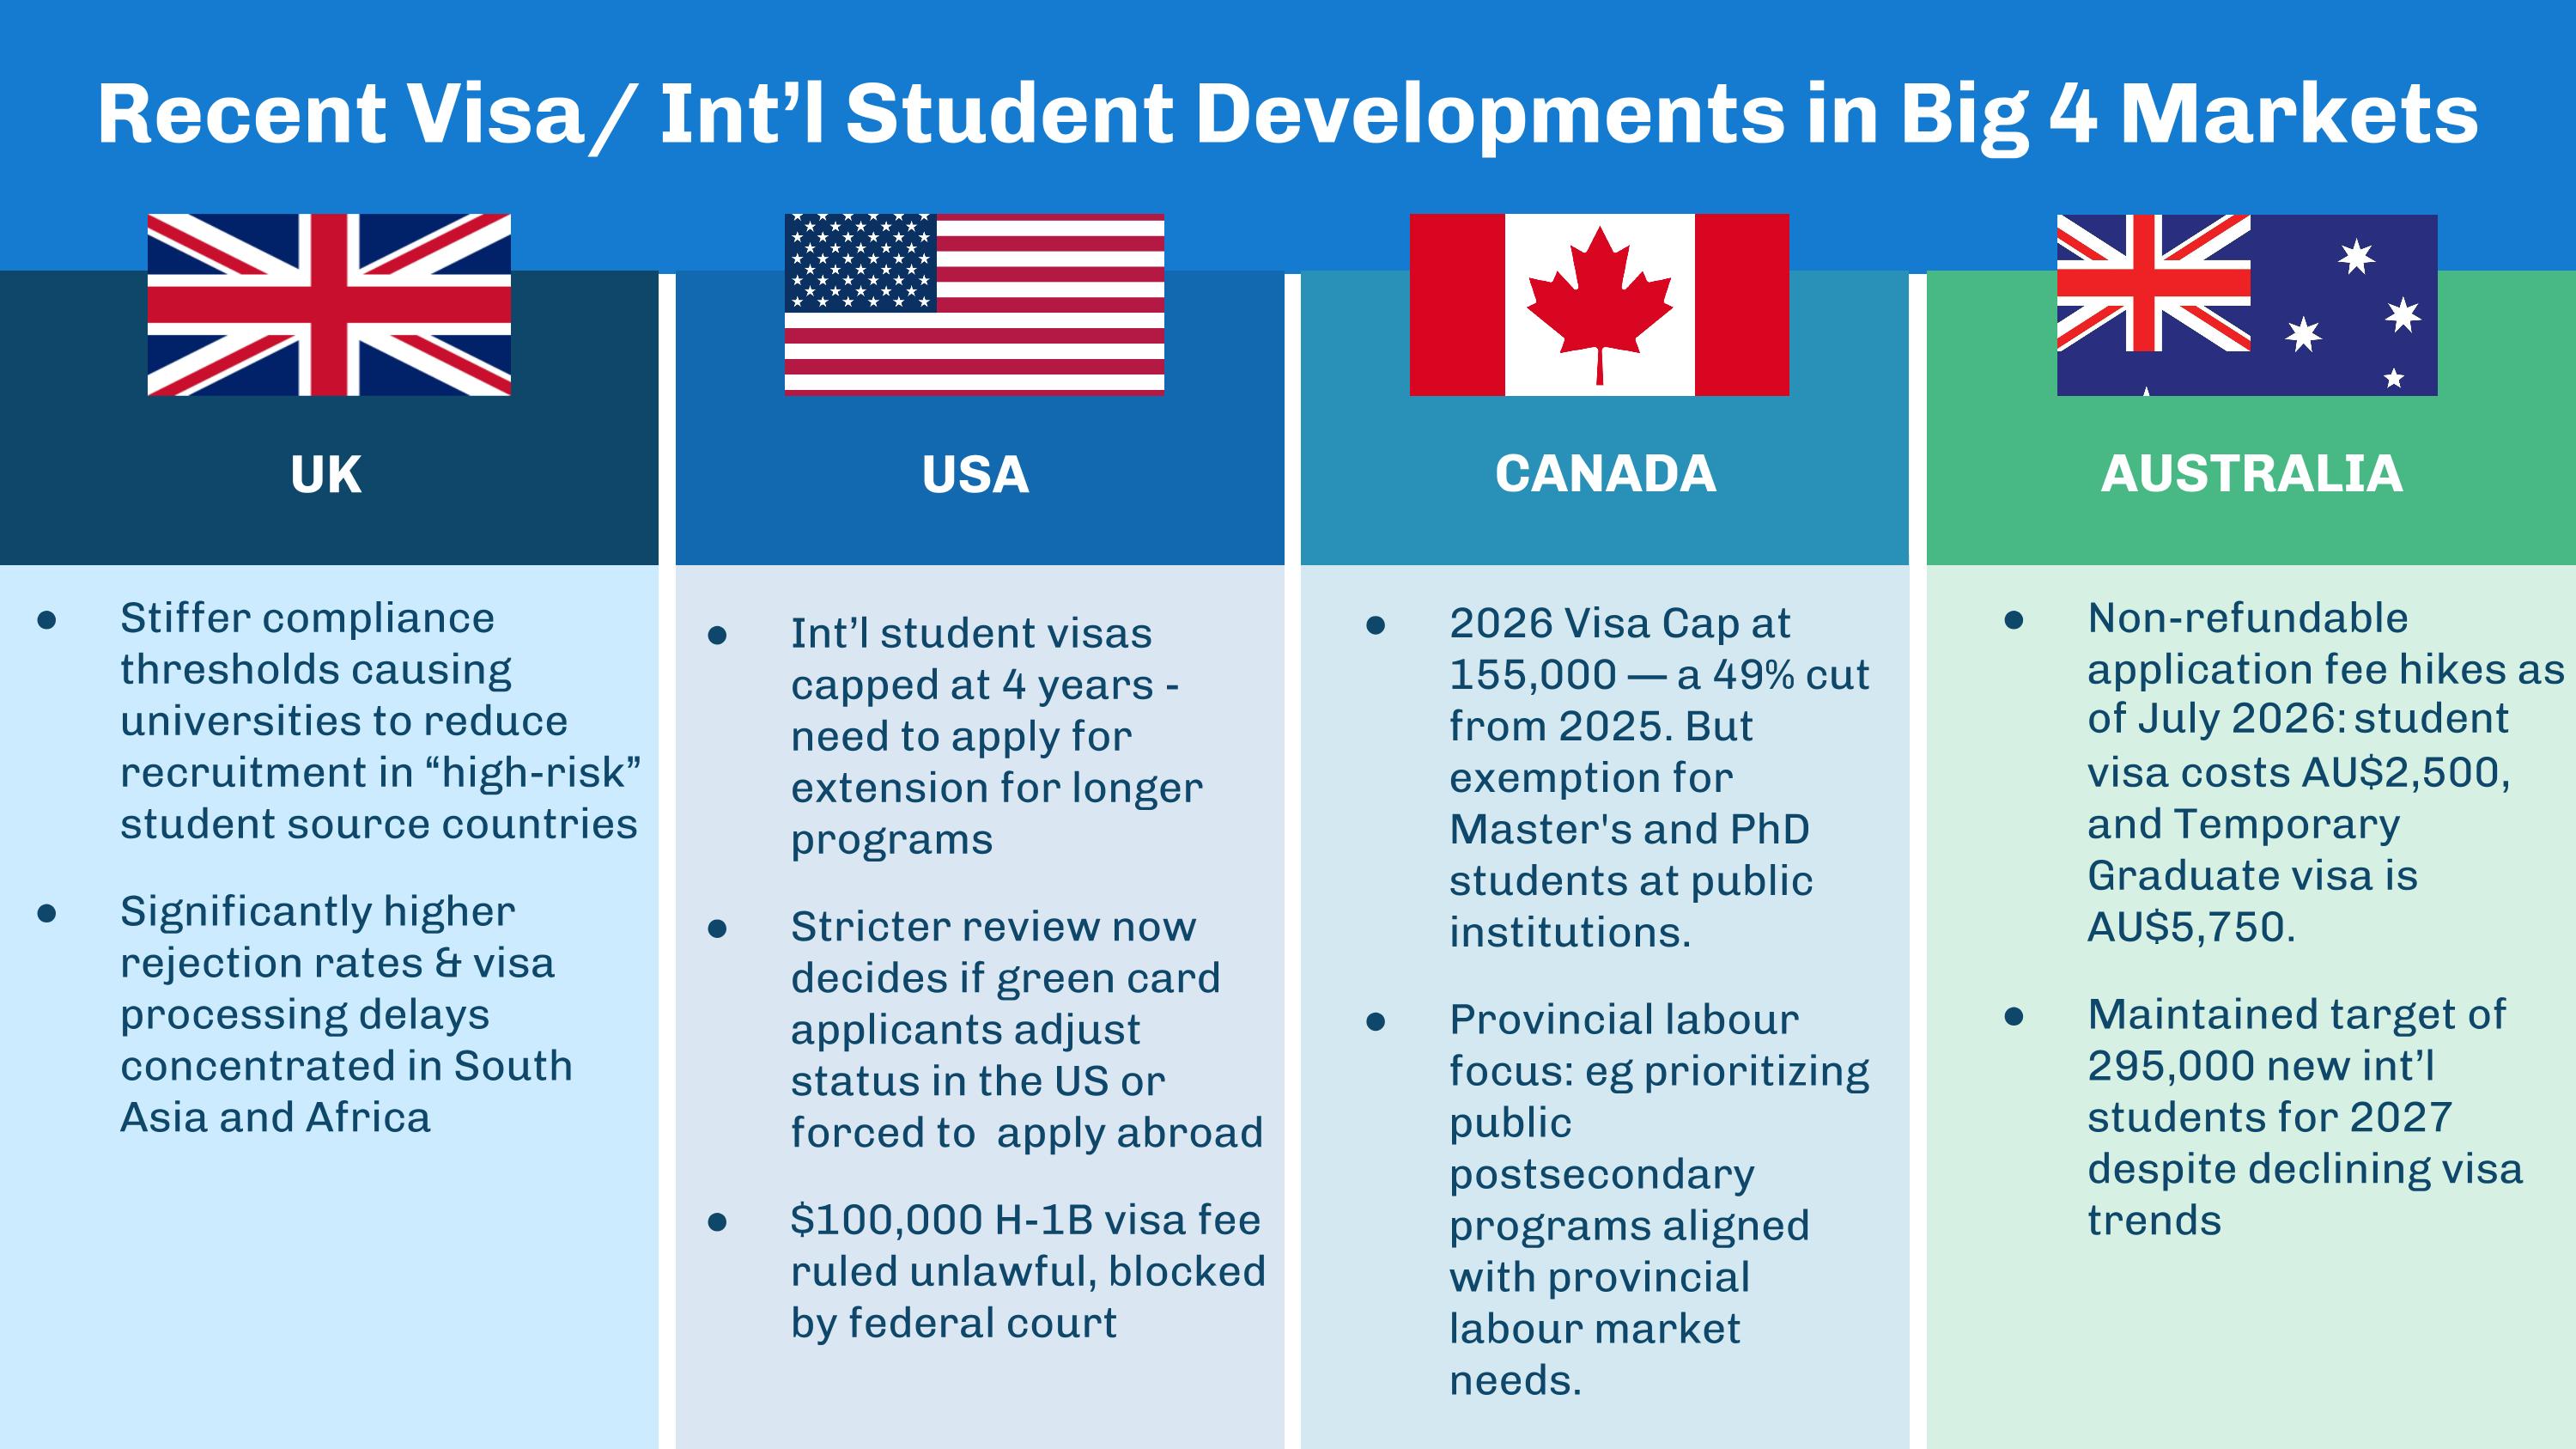
UK USA CANADA AUSTRALIA Recent Visa/ Int’l Student Developments in Big 4 Markets Stiffer compliance thresholds causing universities to reduce recruitment in “high-risk” student source countries Significantly higher rejection rates & visa processing delays concentrated in South Asia and Africa Int’l student visas capped at 4 years - need to apply for extension for longer programs Stricter review now decides if green card applicants adjust status in the US or forced to apply abroad $100,000 H-1B visa fee ruled unlawful, blocked by federal court 2026 Visa Cap at 155,000 — a 49% cut from 2025. But exemption for Master's and PhD students at public institutions. Provincial labour focus: eg prioritizing public postsecondary programs aligned with provincial labour market needs. Non-refundable application fee hikes as of July 2026: student visa costs AU$2,500, and Temporary Graduate visa is AU$5,750. Maintained target of 295,000 new int’l students for 2027 despite declining visa trends

Capital Allocation �& Structure
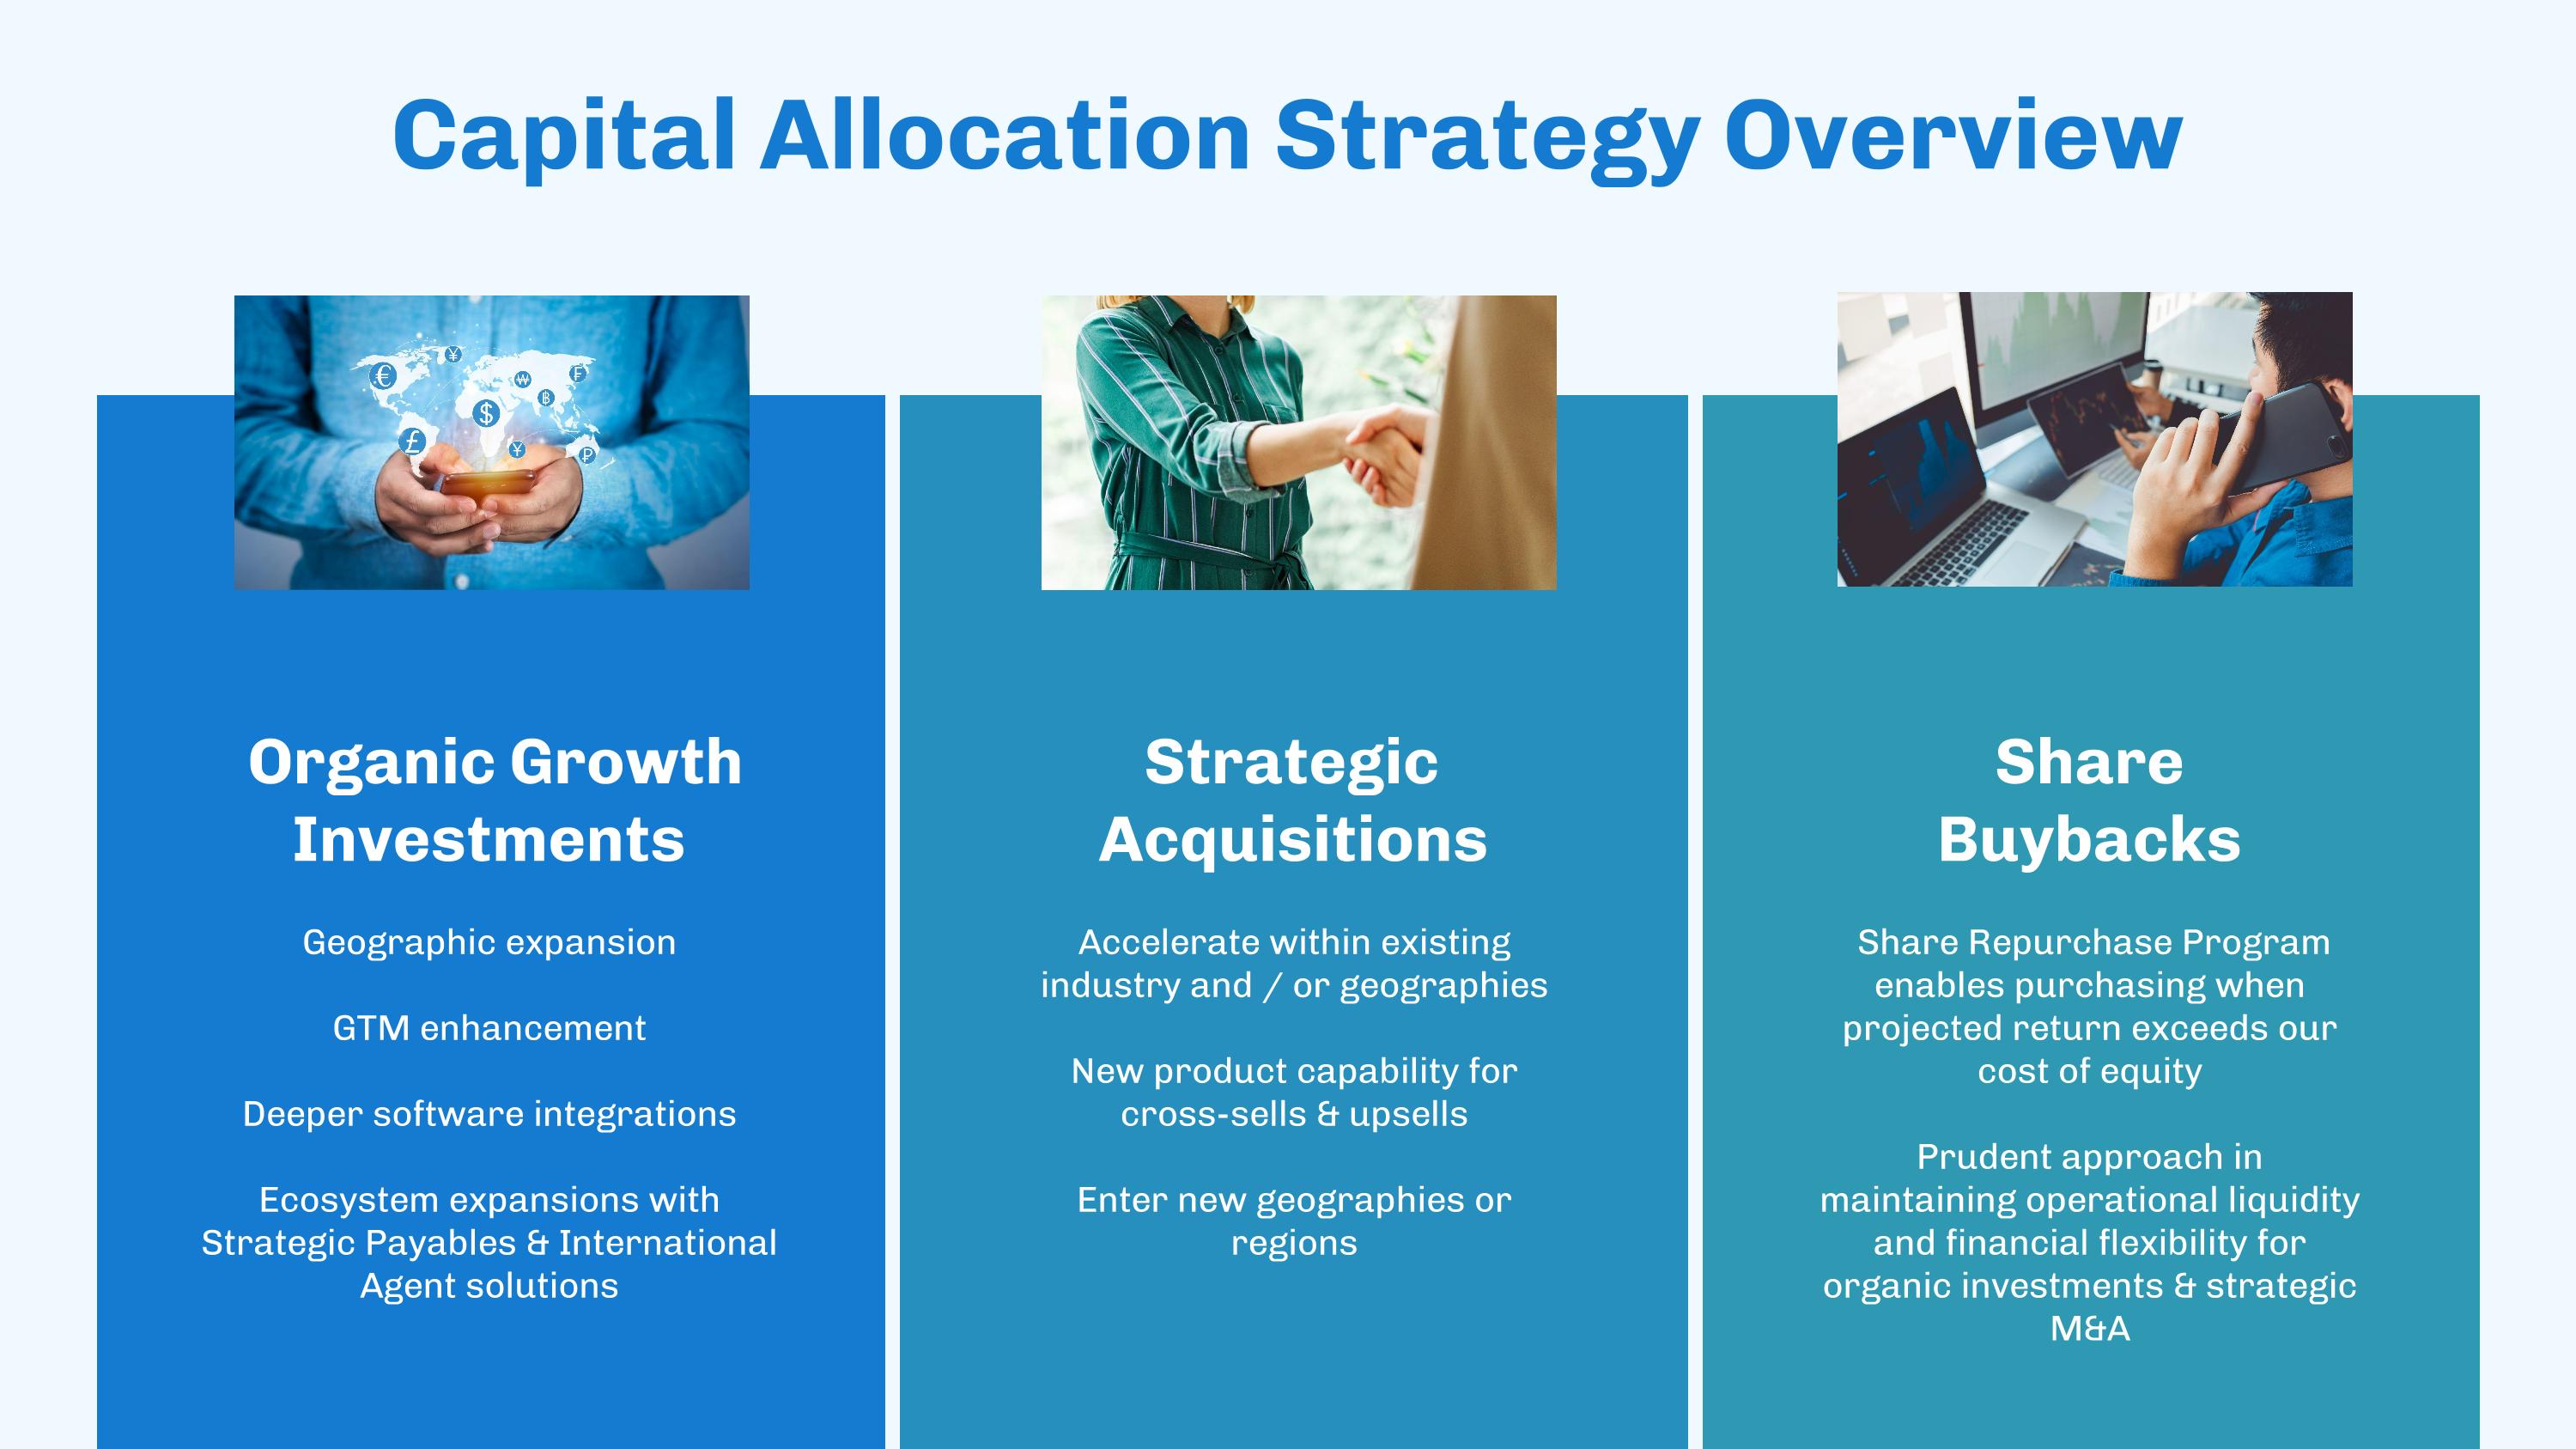
Capital Allocation Strategy Overview Organic Growth Investments��Geographic expansion GTM enhancement Deeper software integrations Ecosystem expansions with Strategic Payables & International Agent solutions Strategic�Acquisitions��Accelerate within existing industry and / or geographies New product capability for cross-sells & upsells Enter new geographies or regions Share�Buybacks�� Share Repurchase Program enables purchasing when projected return exceeds our cost of equity Prudent approach in maintaining operational liquidity and financial flexibility for organic investments & strategic M&A
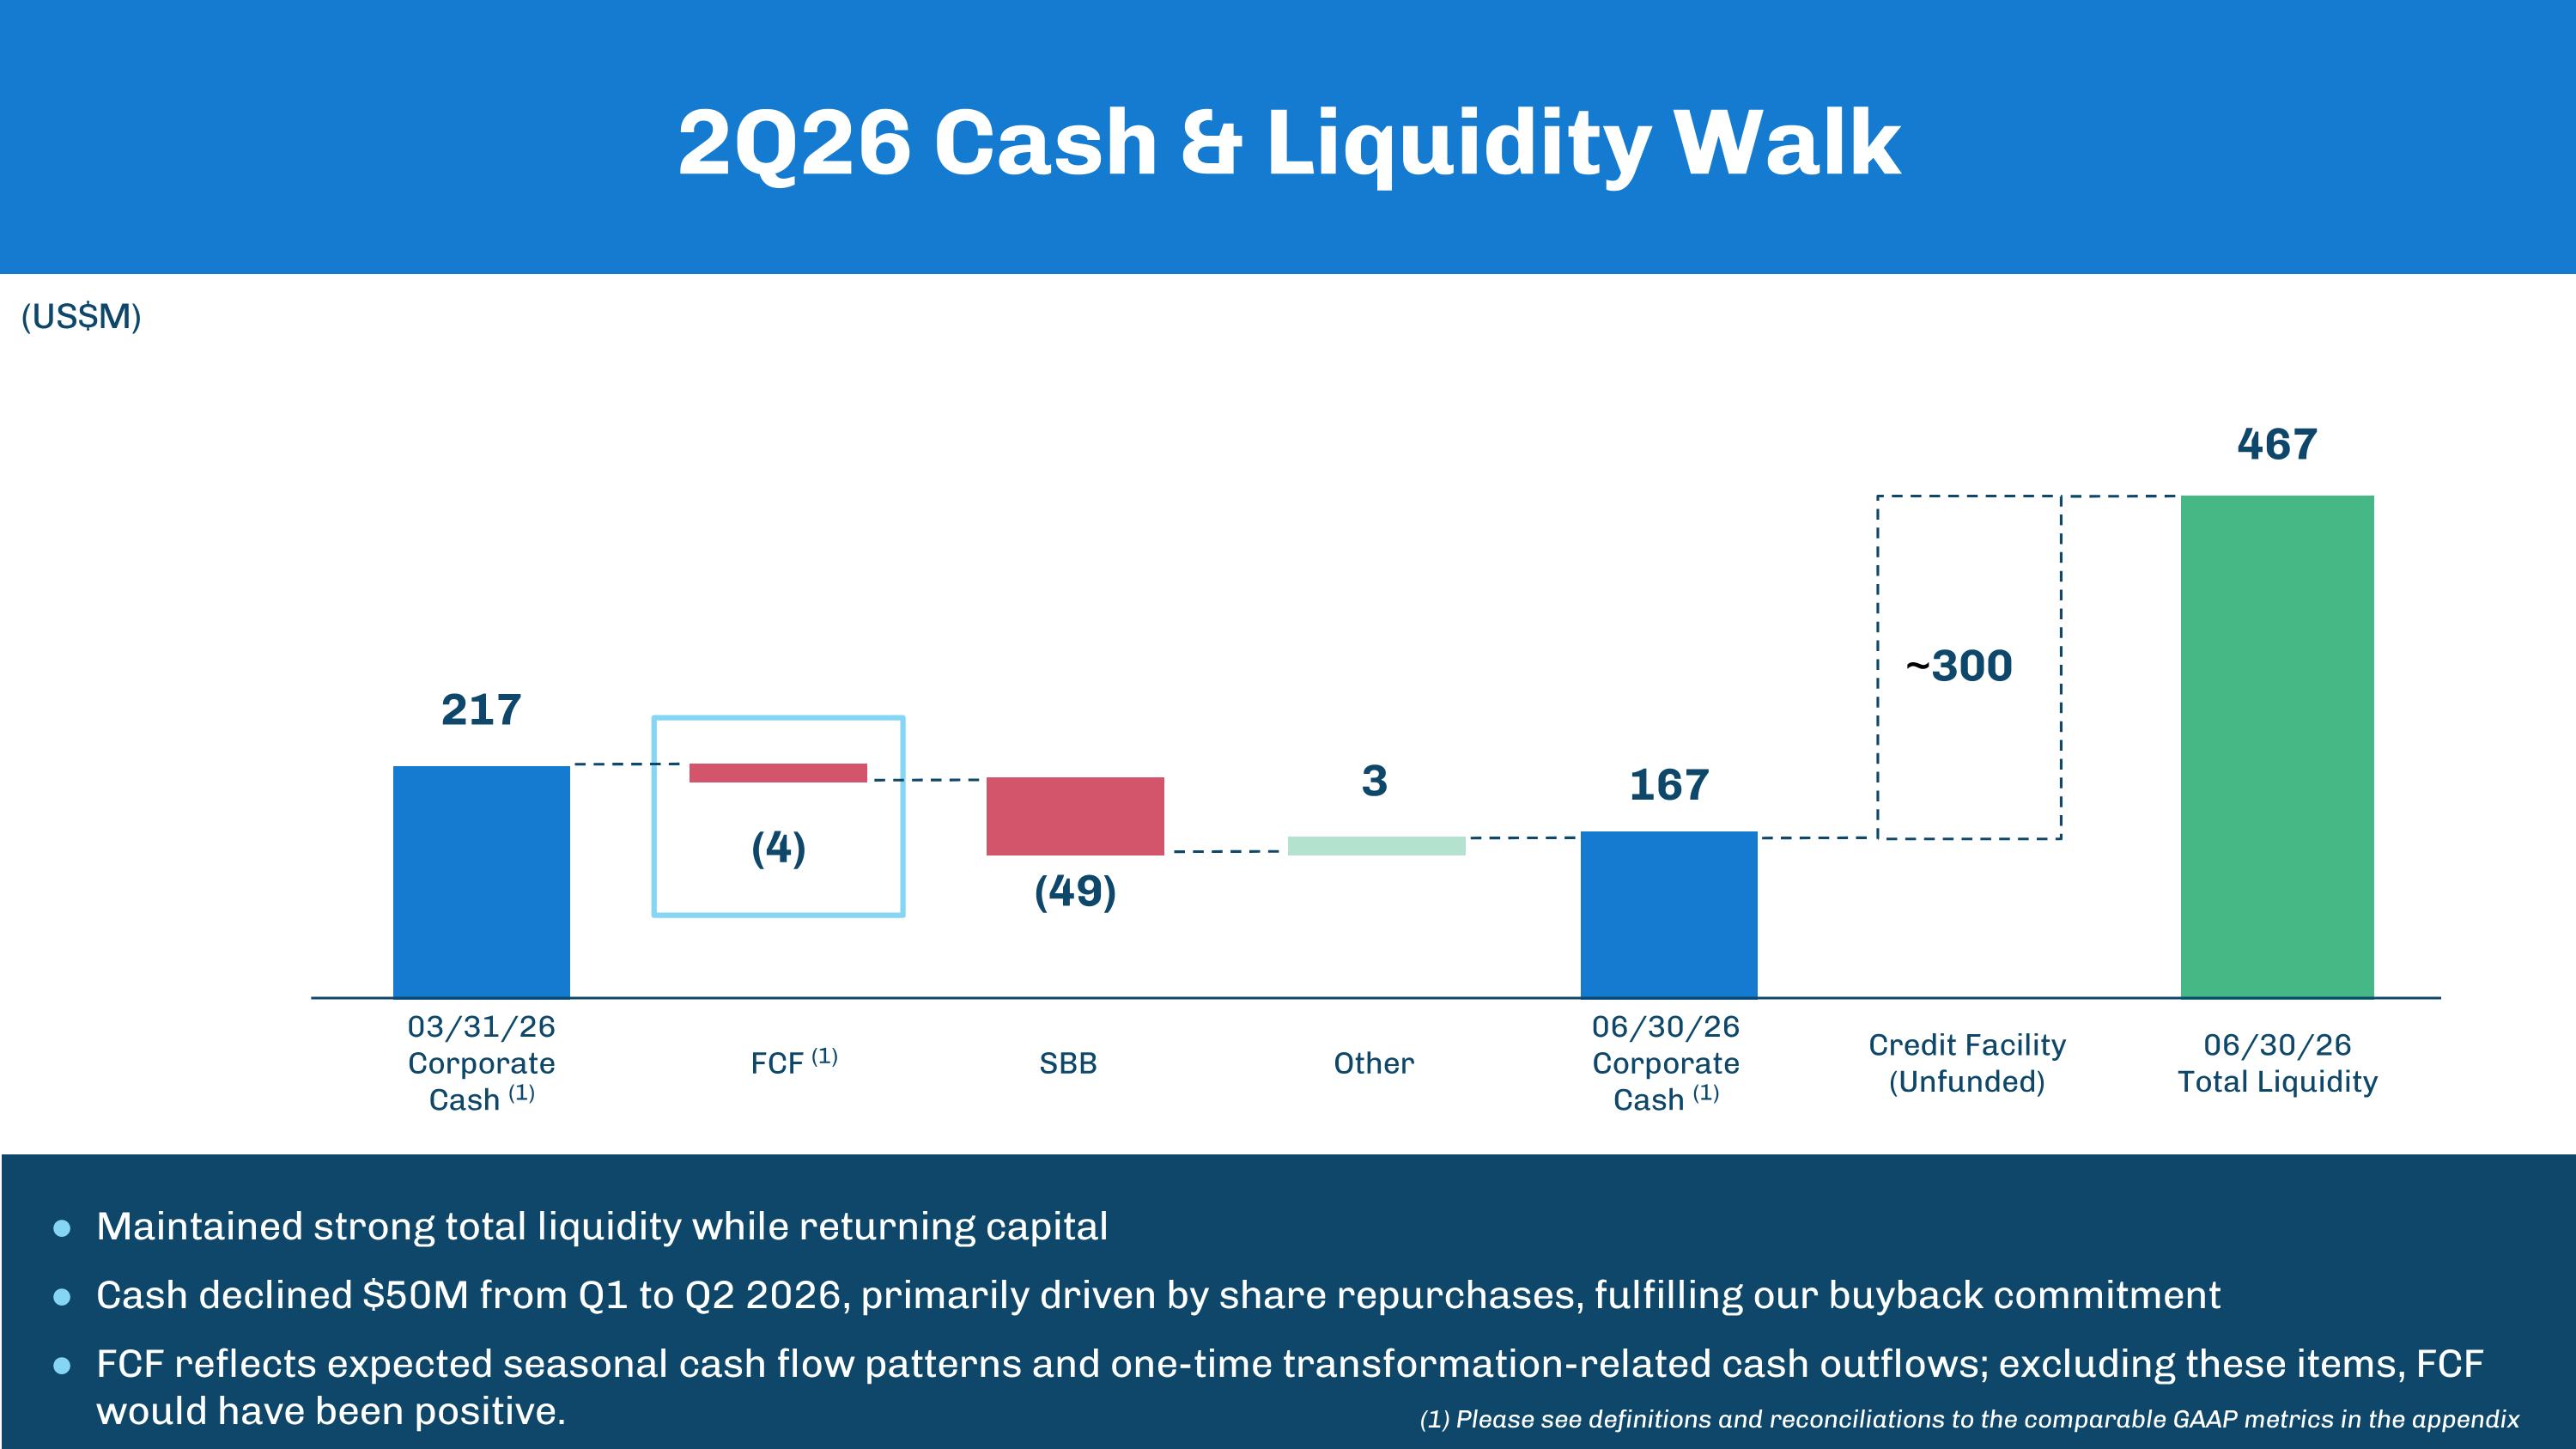
Maintained strong total liquidity while returning capital Cash declined $50M from Q1 to Q2 2026, primarily driven by share repurchases, fulfilling our buyback commitment FCF reflects expected seasonal cash flow patterns and one-time transformation-related cash outflows; excluding these items, FCF would have been positive. 2Q26 Cash & Liquidity Walk (US$M) (1) 217 03/31/26 Corporate Cash (1) (4) (49) 167 FCF (1) SBB 06/30/26 Corporate Cash (1) Credit Facility (Unfunded) 300 467 06/30/26 Total Liquidity ~ 3 Other (1) Please see definitions and reconciliations to the comparable GAAP metrics in the appendix
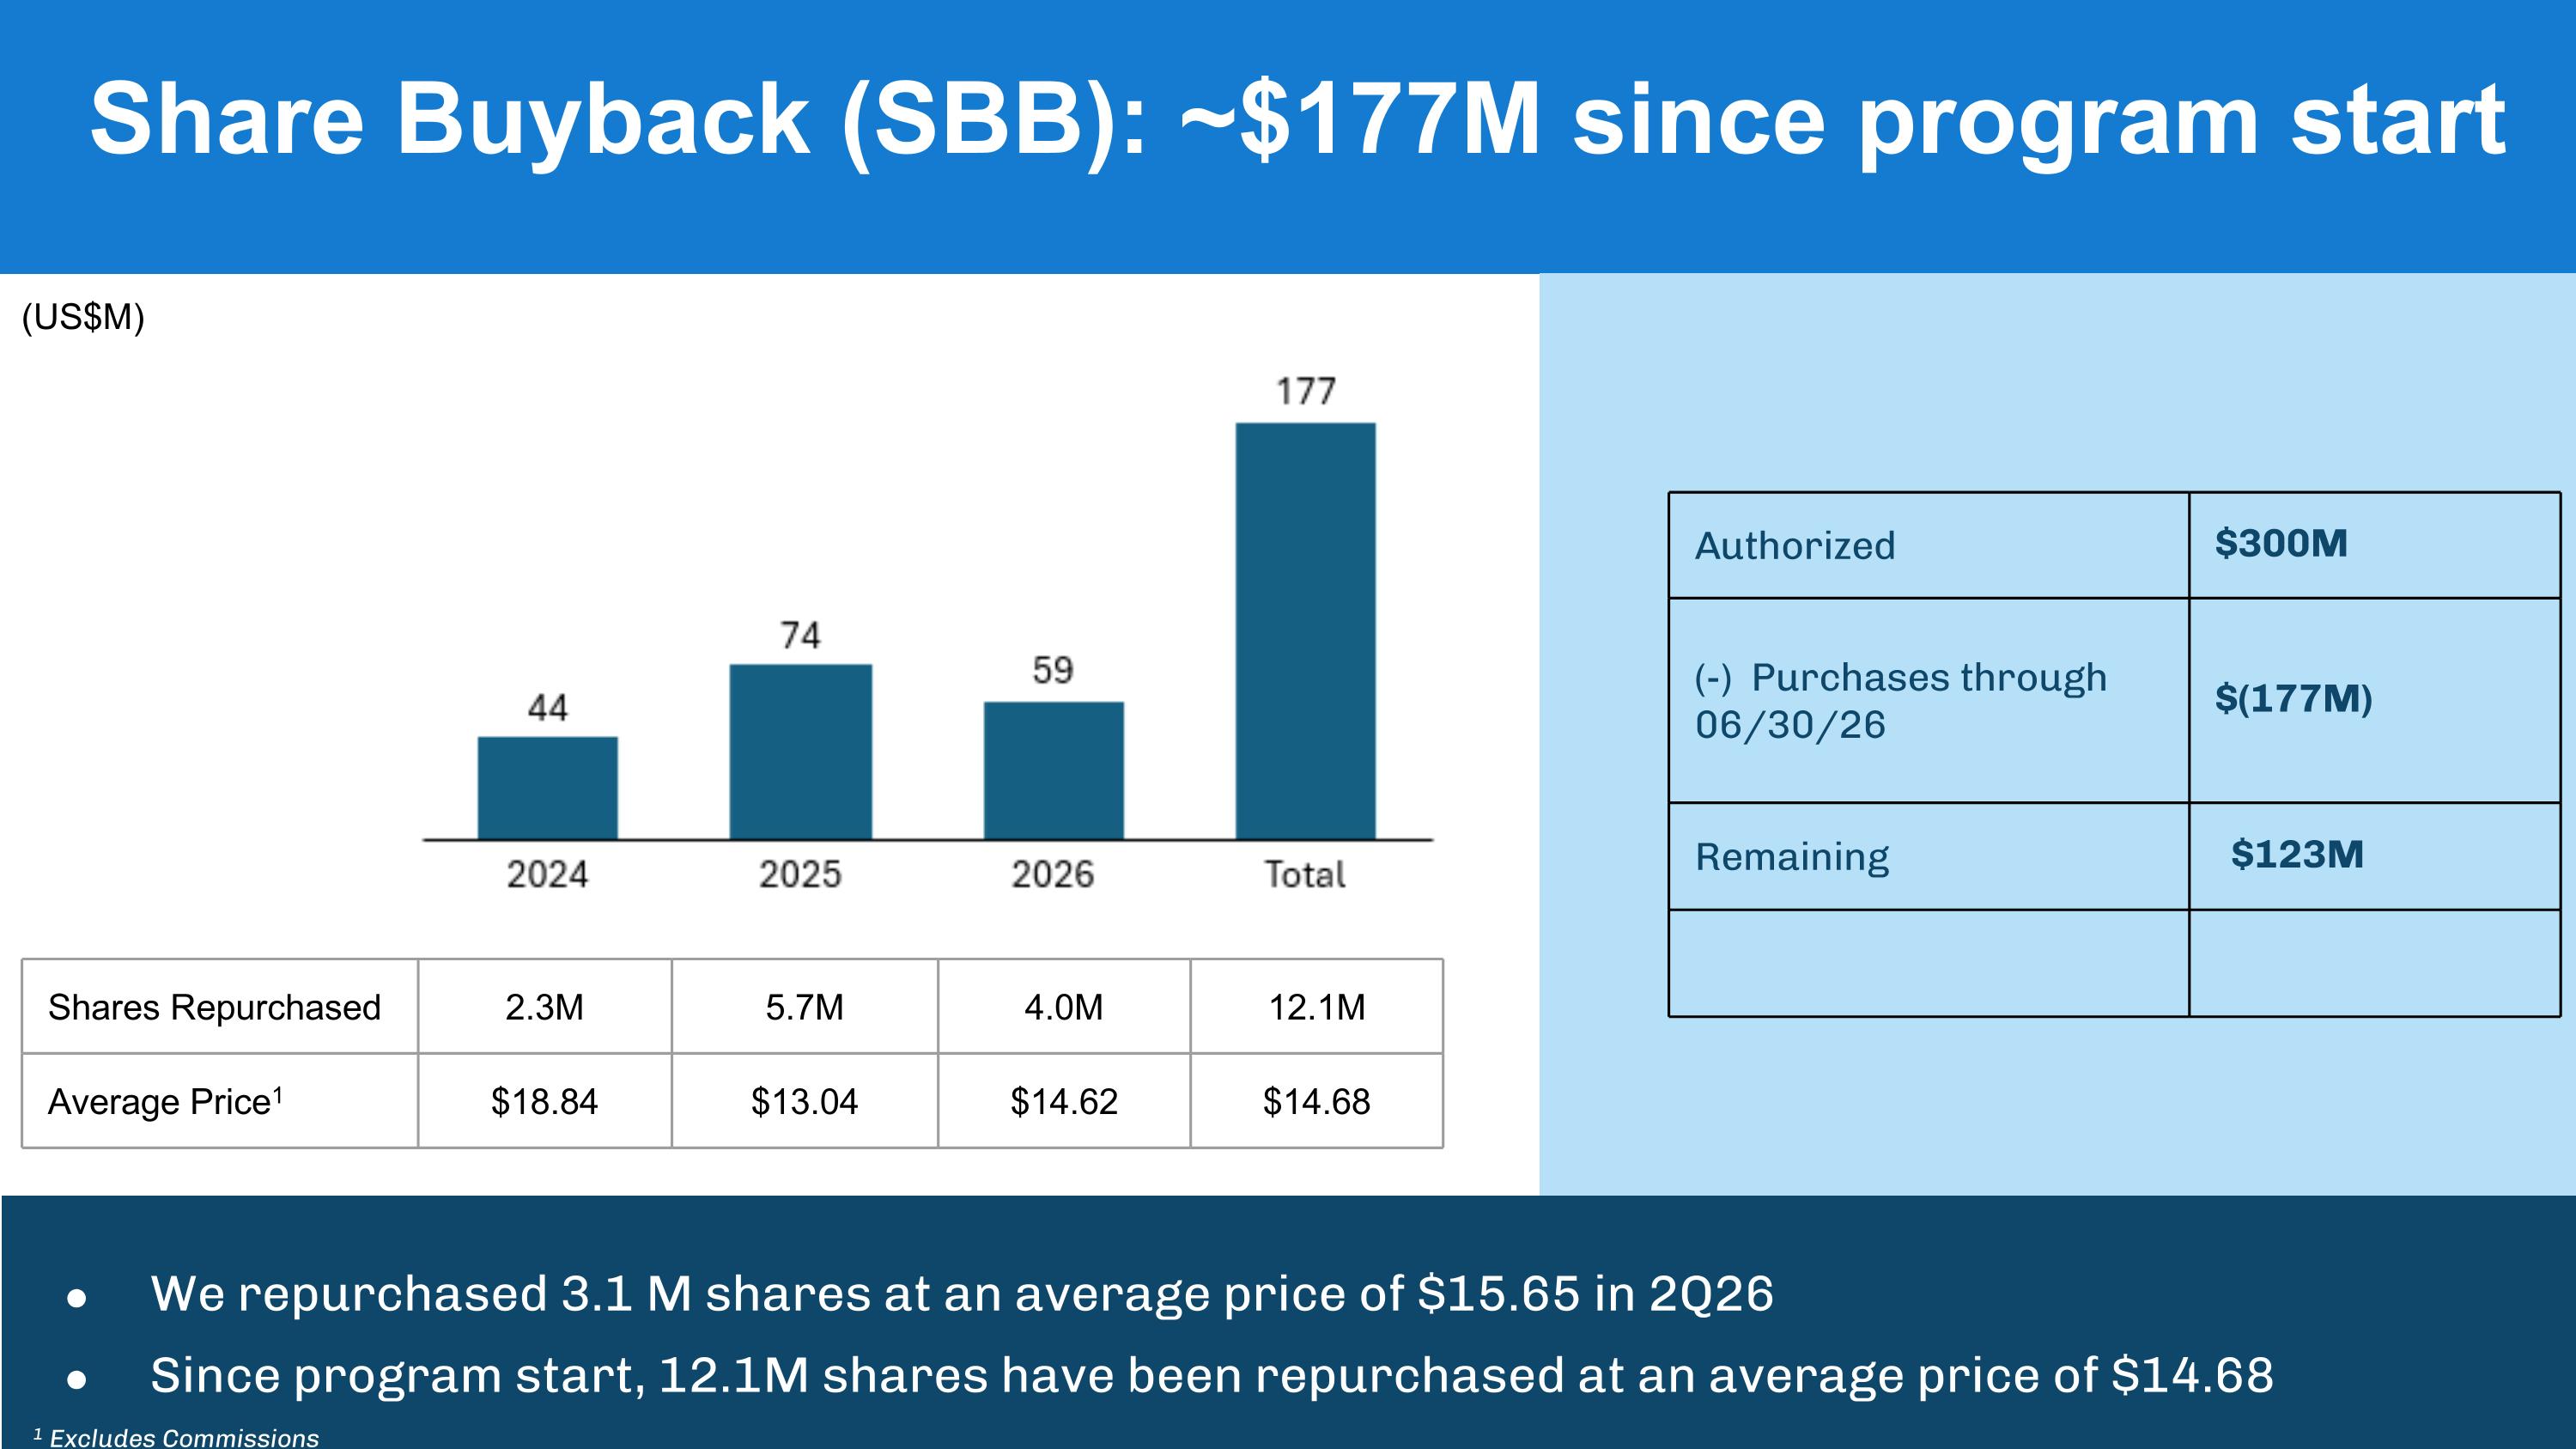
Share Buyback (SBB): ~$177M since program start Authorized $300M (-) Purchases through 06/30/26 $(177M) Remaining $123M We repurchased 3.1 M shares at an average price of $15.65 in 2Q26 Since program start, 12.1M shares have been repurchased at an average price of $14.68 (US$M) Shares Repurchased 2.3M 5.7M 4.0M 12.1M Average Price1 $18.84 $13.04 $14.62 $14.68 1 Excludes Commissions

Appendix
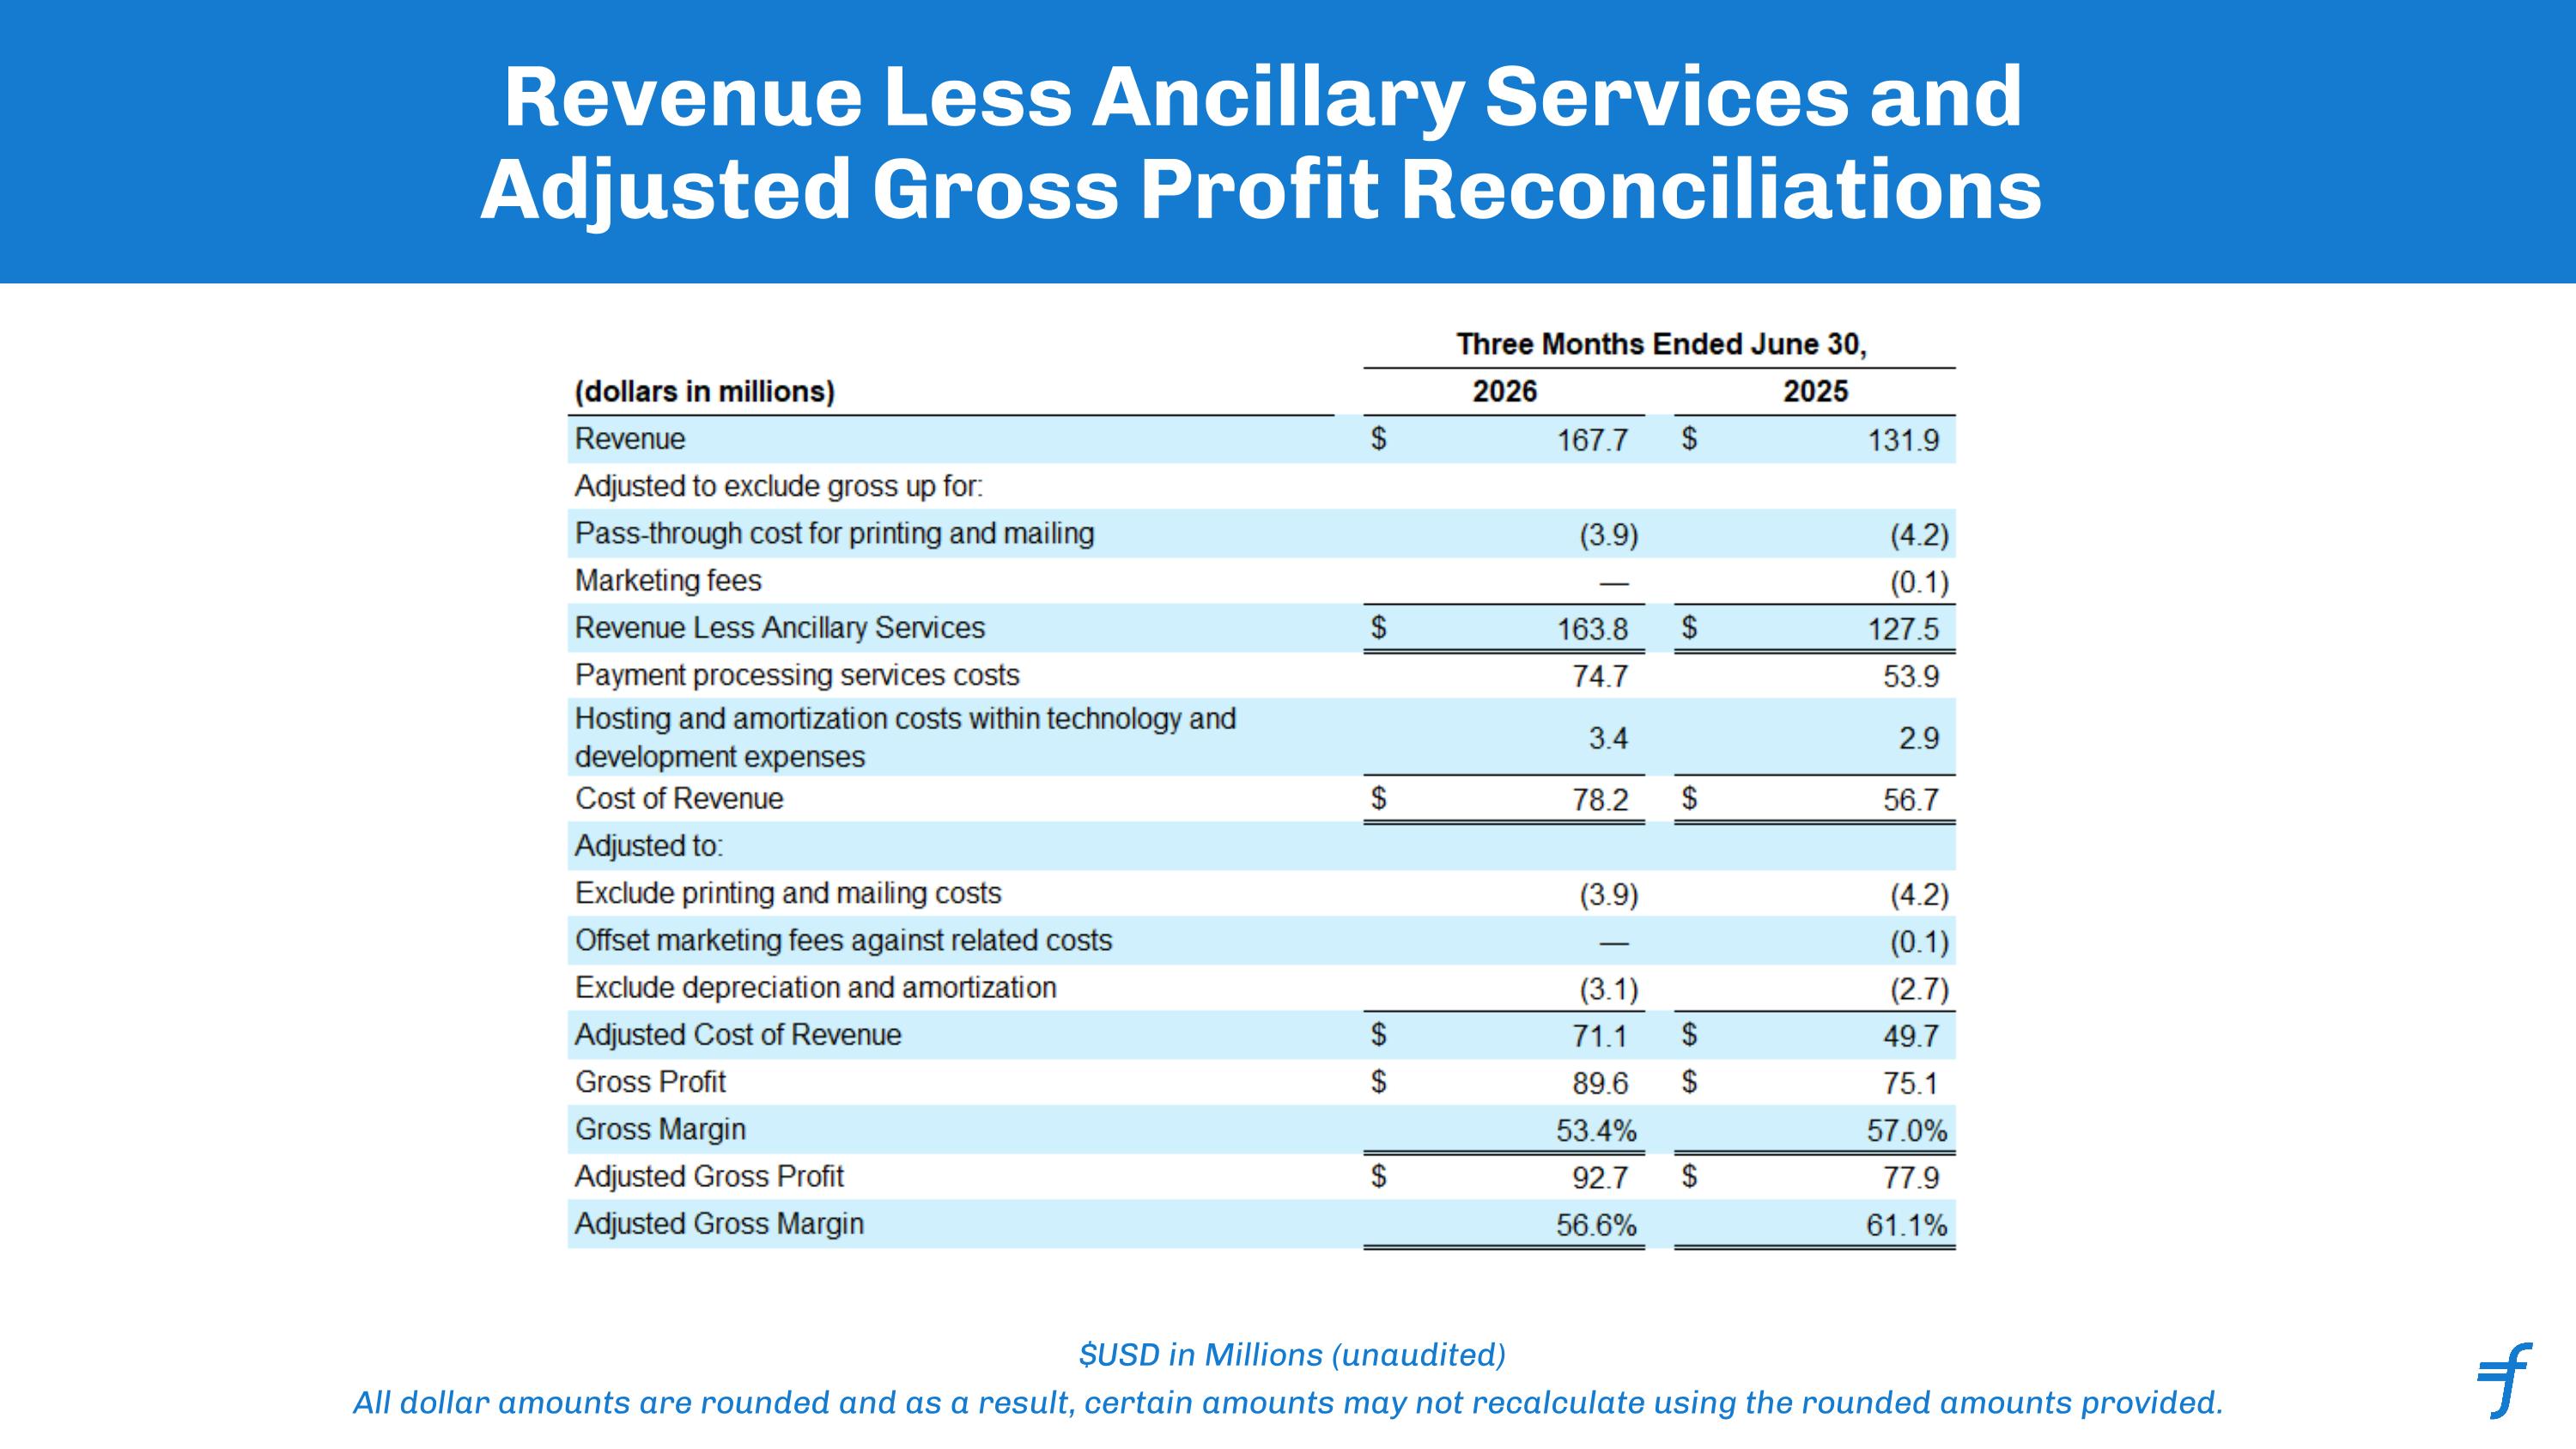
Revenue Less Ancillary Services and Adjusted Gross Profit Reconciliations $USD in Millions (unaudited) All dollar amounts are rounded and as a result, certain amounts may not recalculate using the rounded amounts provided.
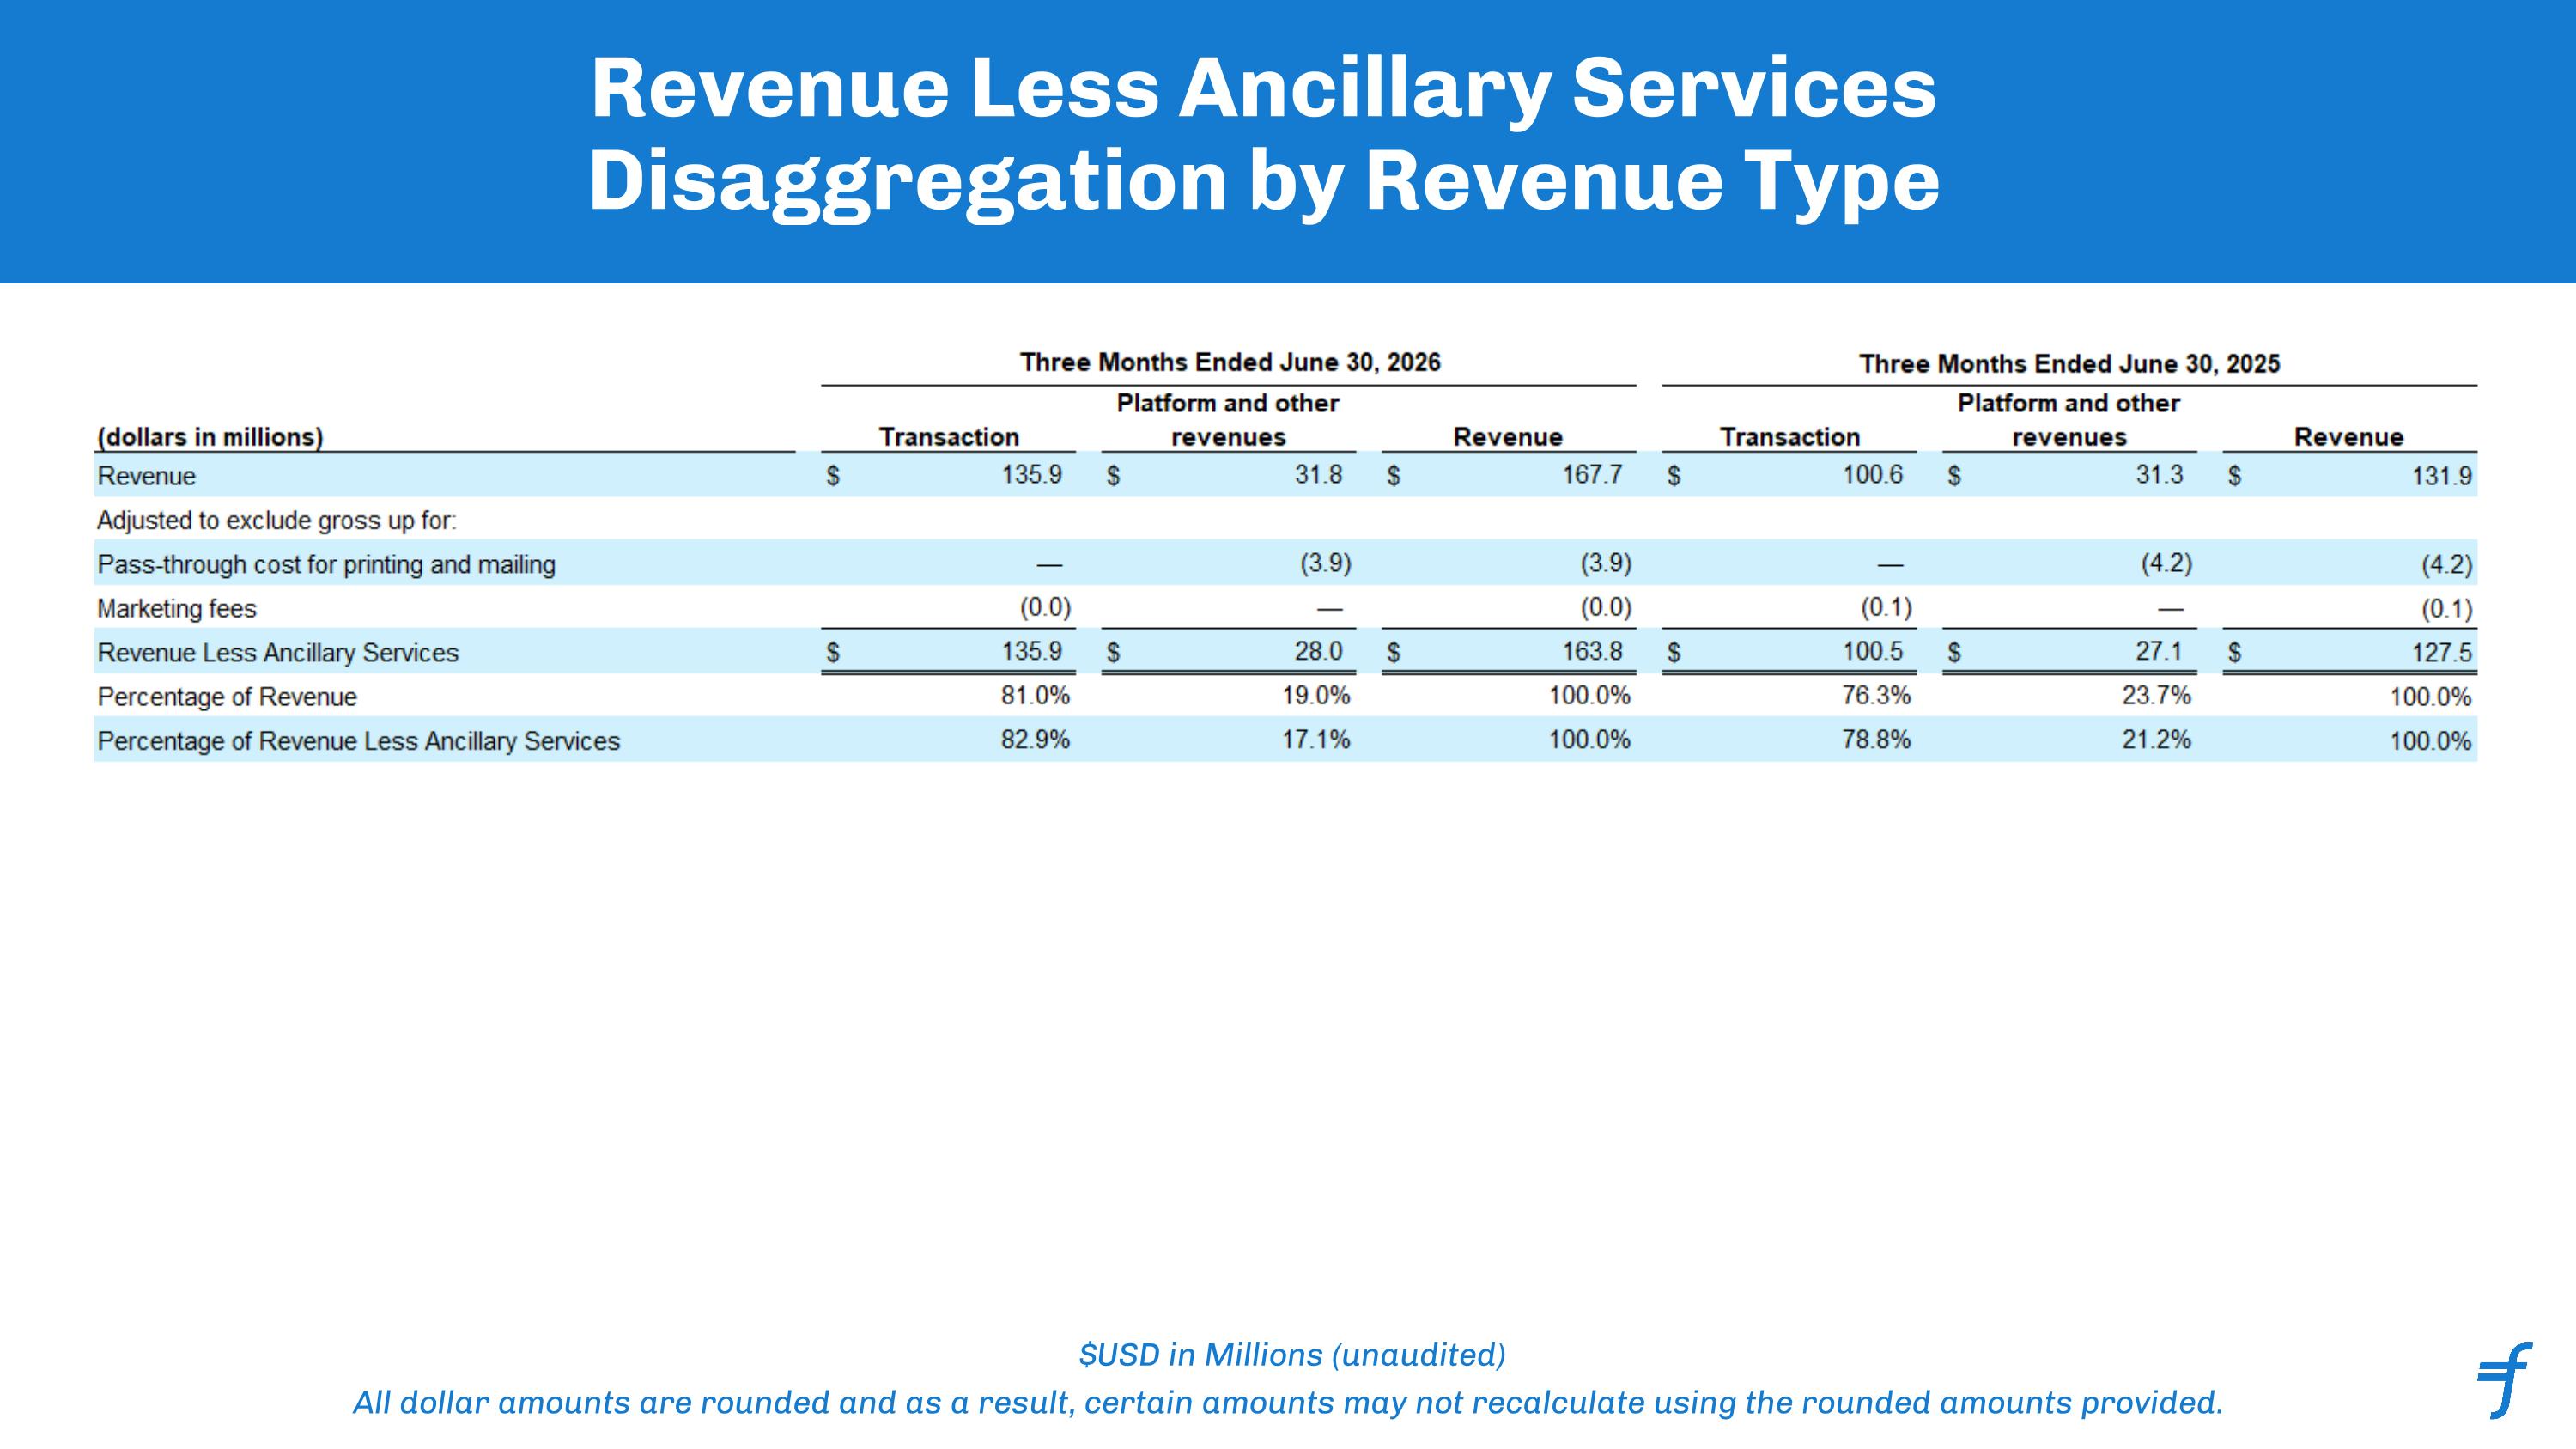
Revenue Less Ancillary Services Disaggregation by Revenue Type $USD in Millions (unaudited) All dollar amounts are rounded and as a result, certain amounts may not recalculate using the rounded amounts provided.
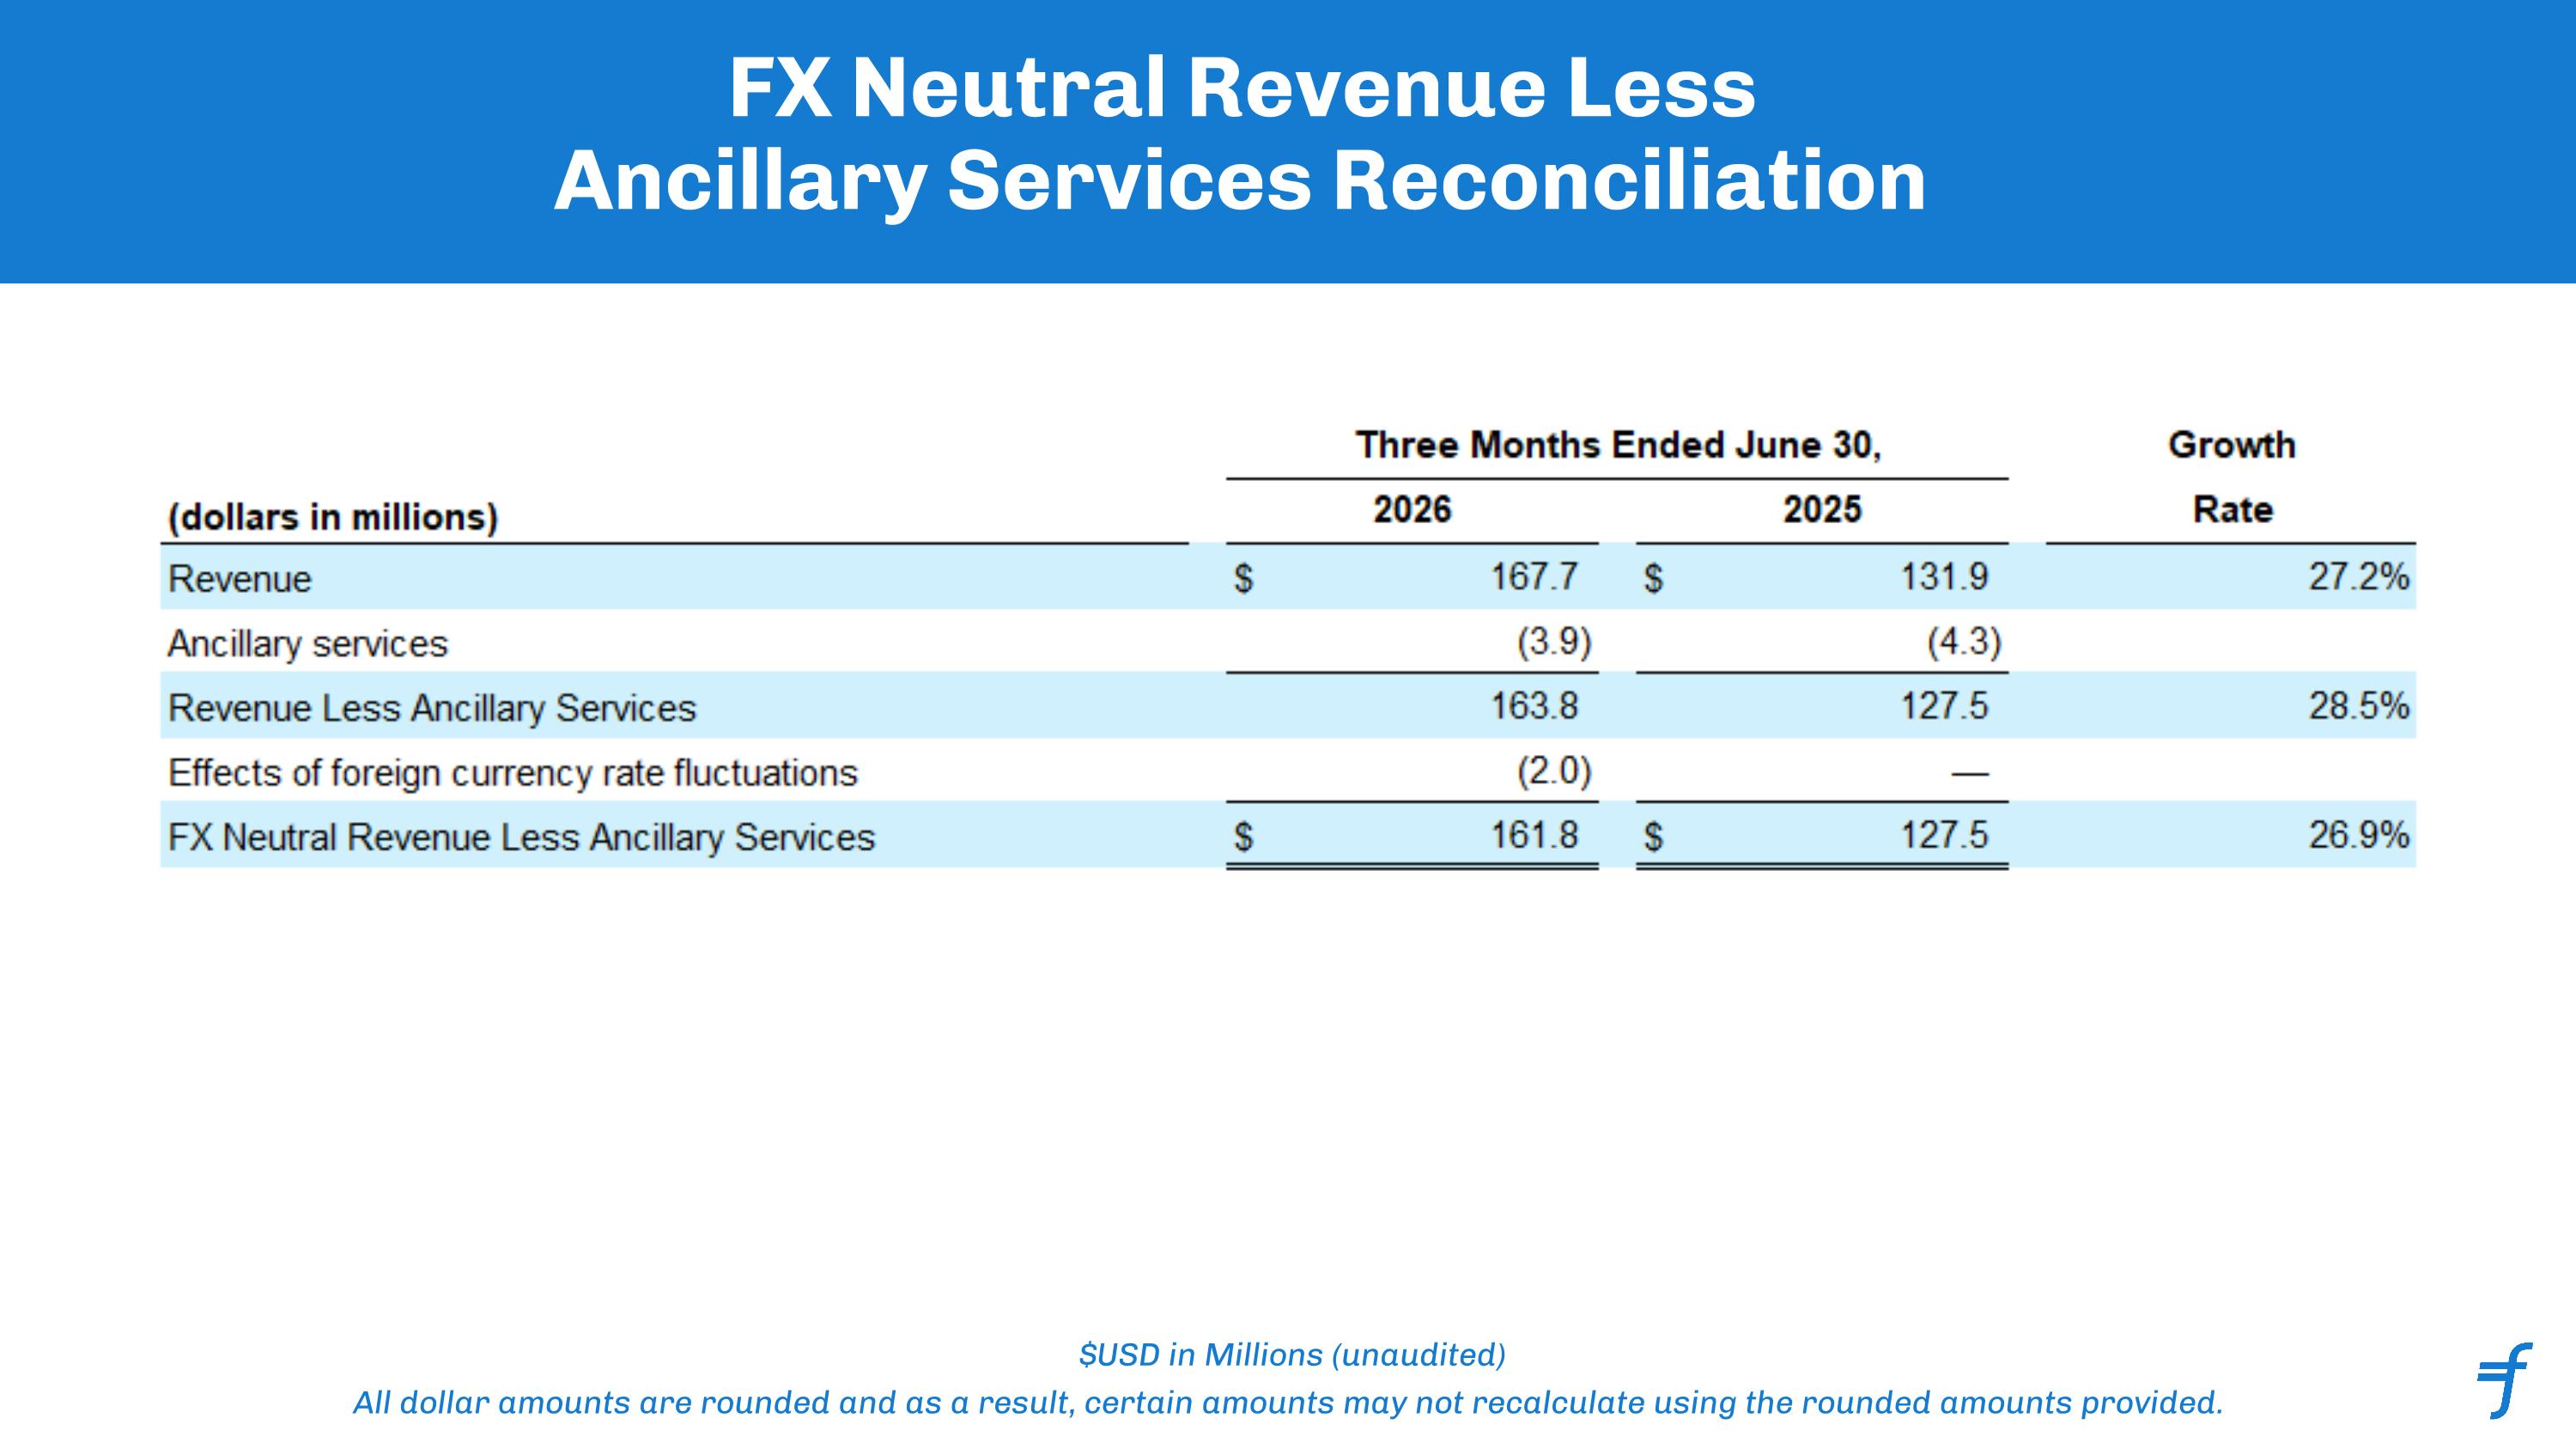
FX Neutral Revenue Less Ancillary Services Reconciliation $USD in Millions (unaudited) All dollar amounts are rounded and as a result, certain amounts may not recalculate using the rounded amounts provided.
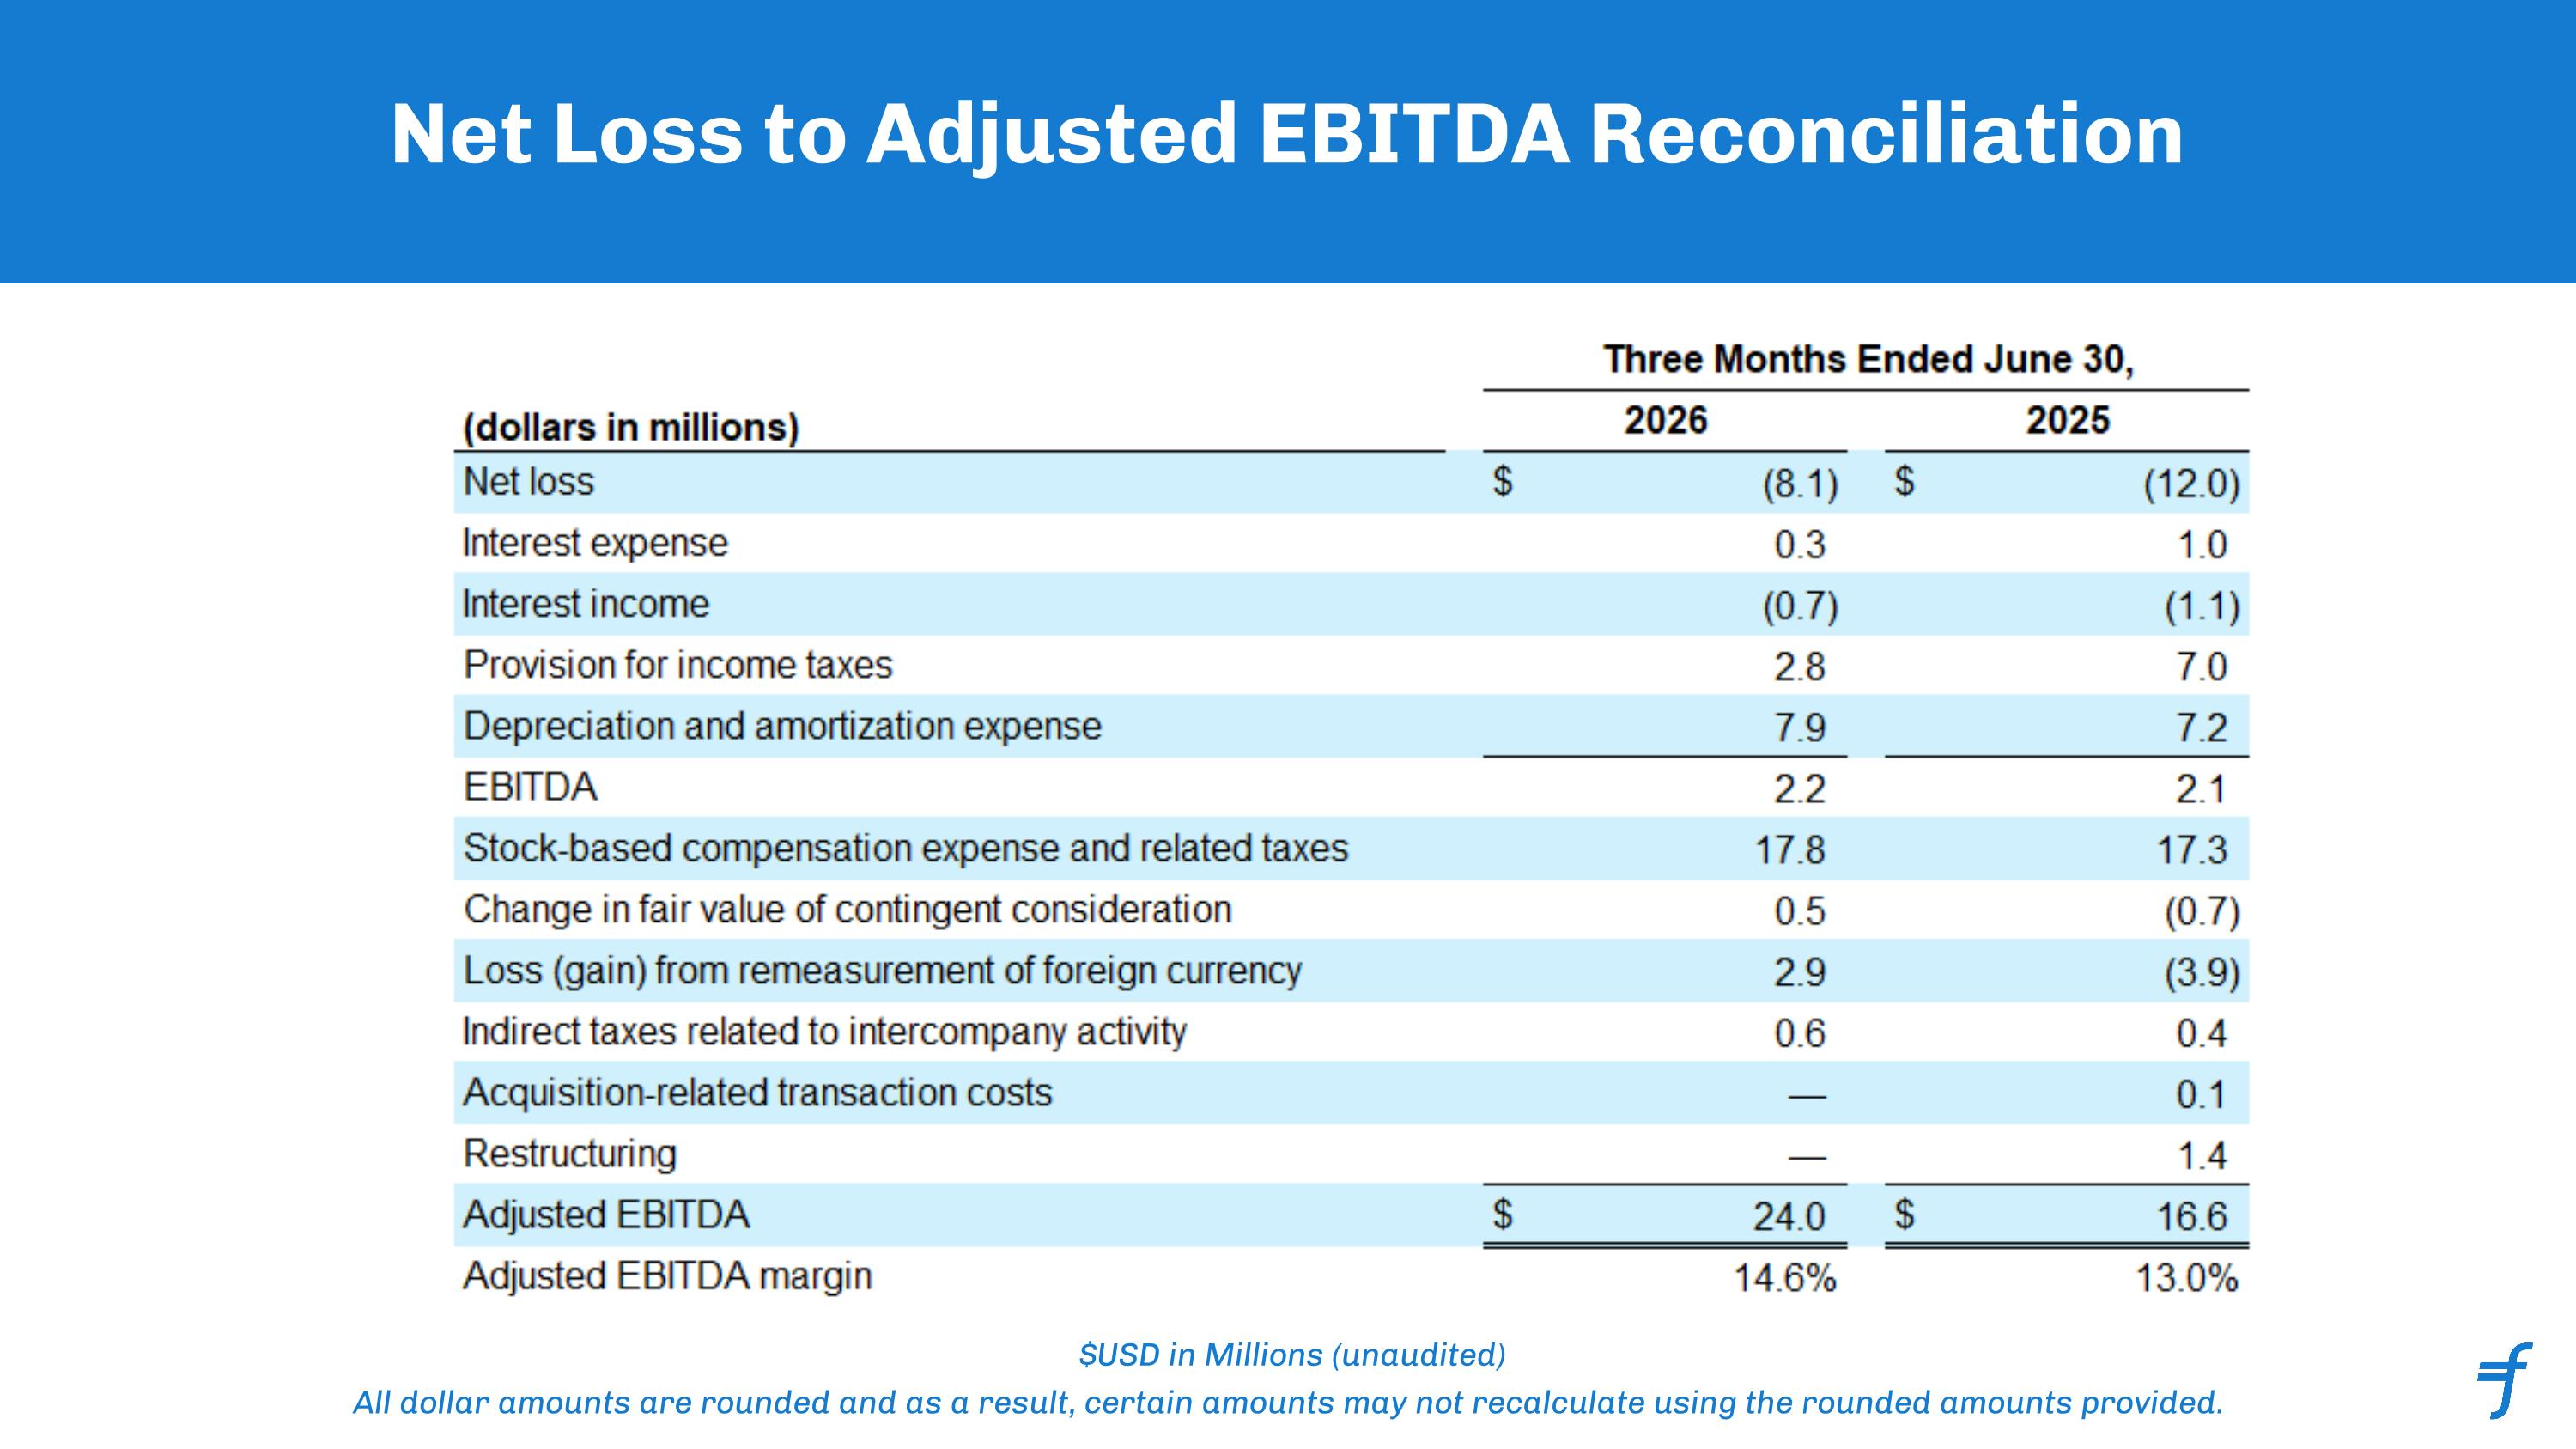
Net Loss to Adjusted EBITDA Reconciliation $USD in Millions (unaudited) All dollar amounts are rounded and as a result, certain amounts may not recalculate using the rounded amounts provided.
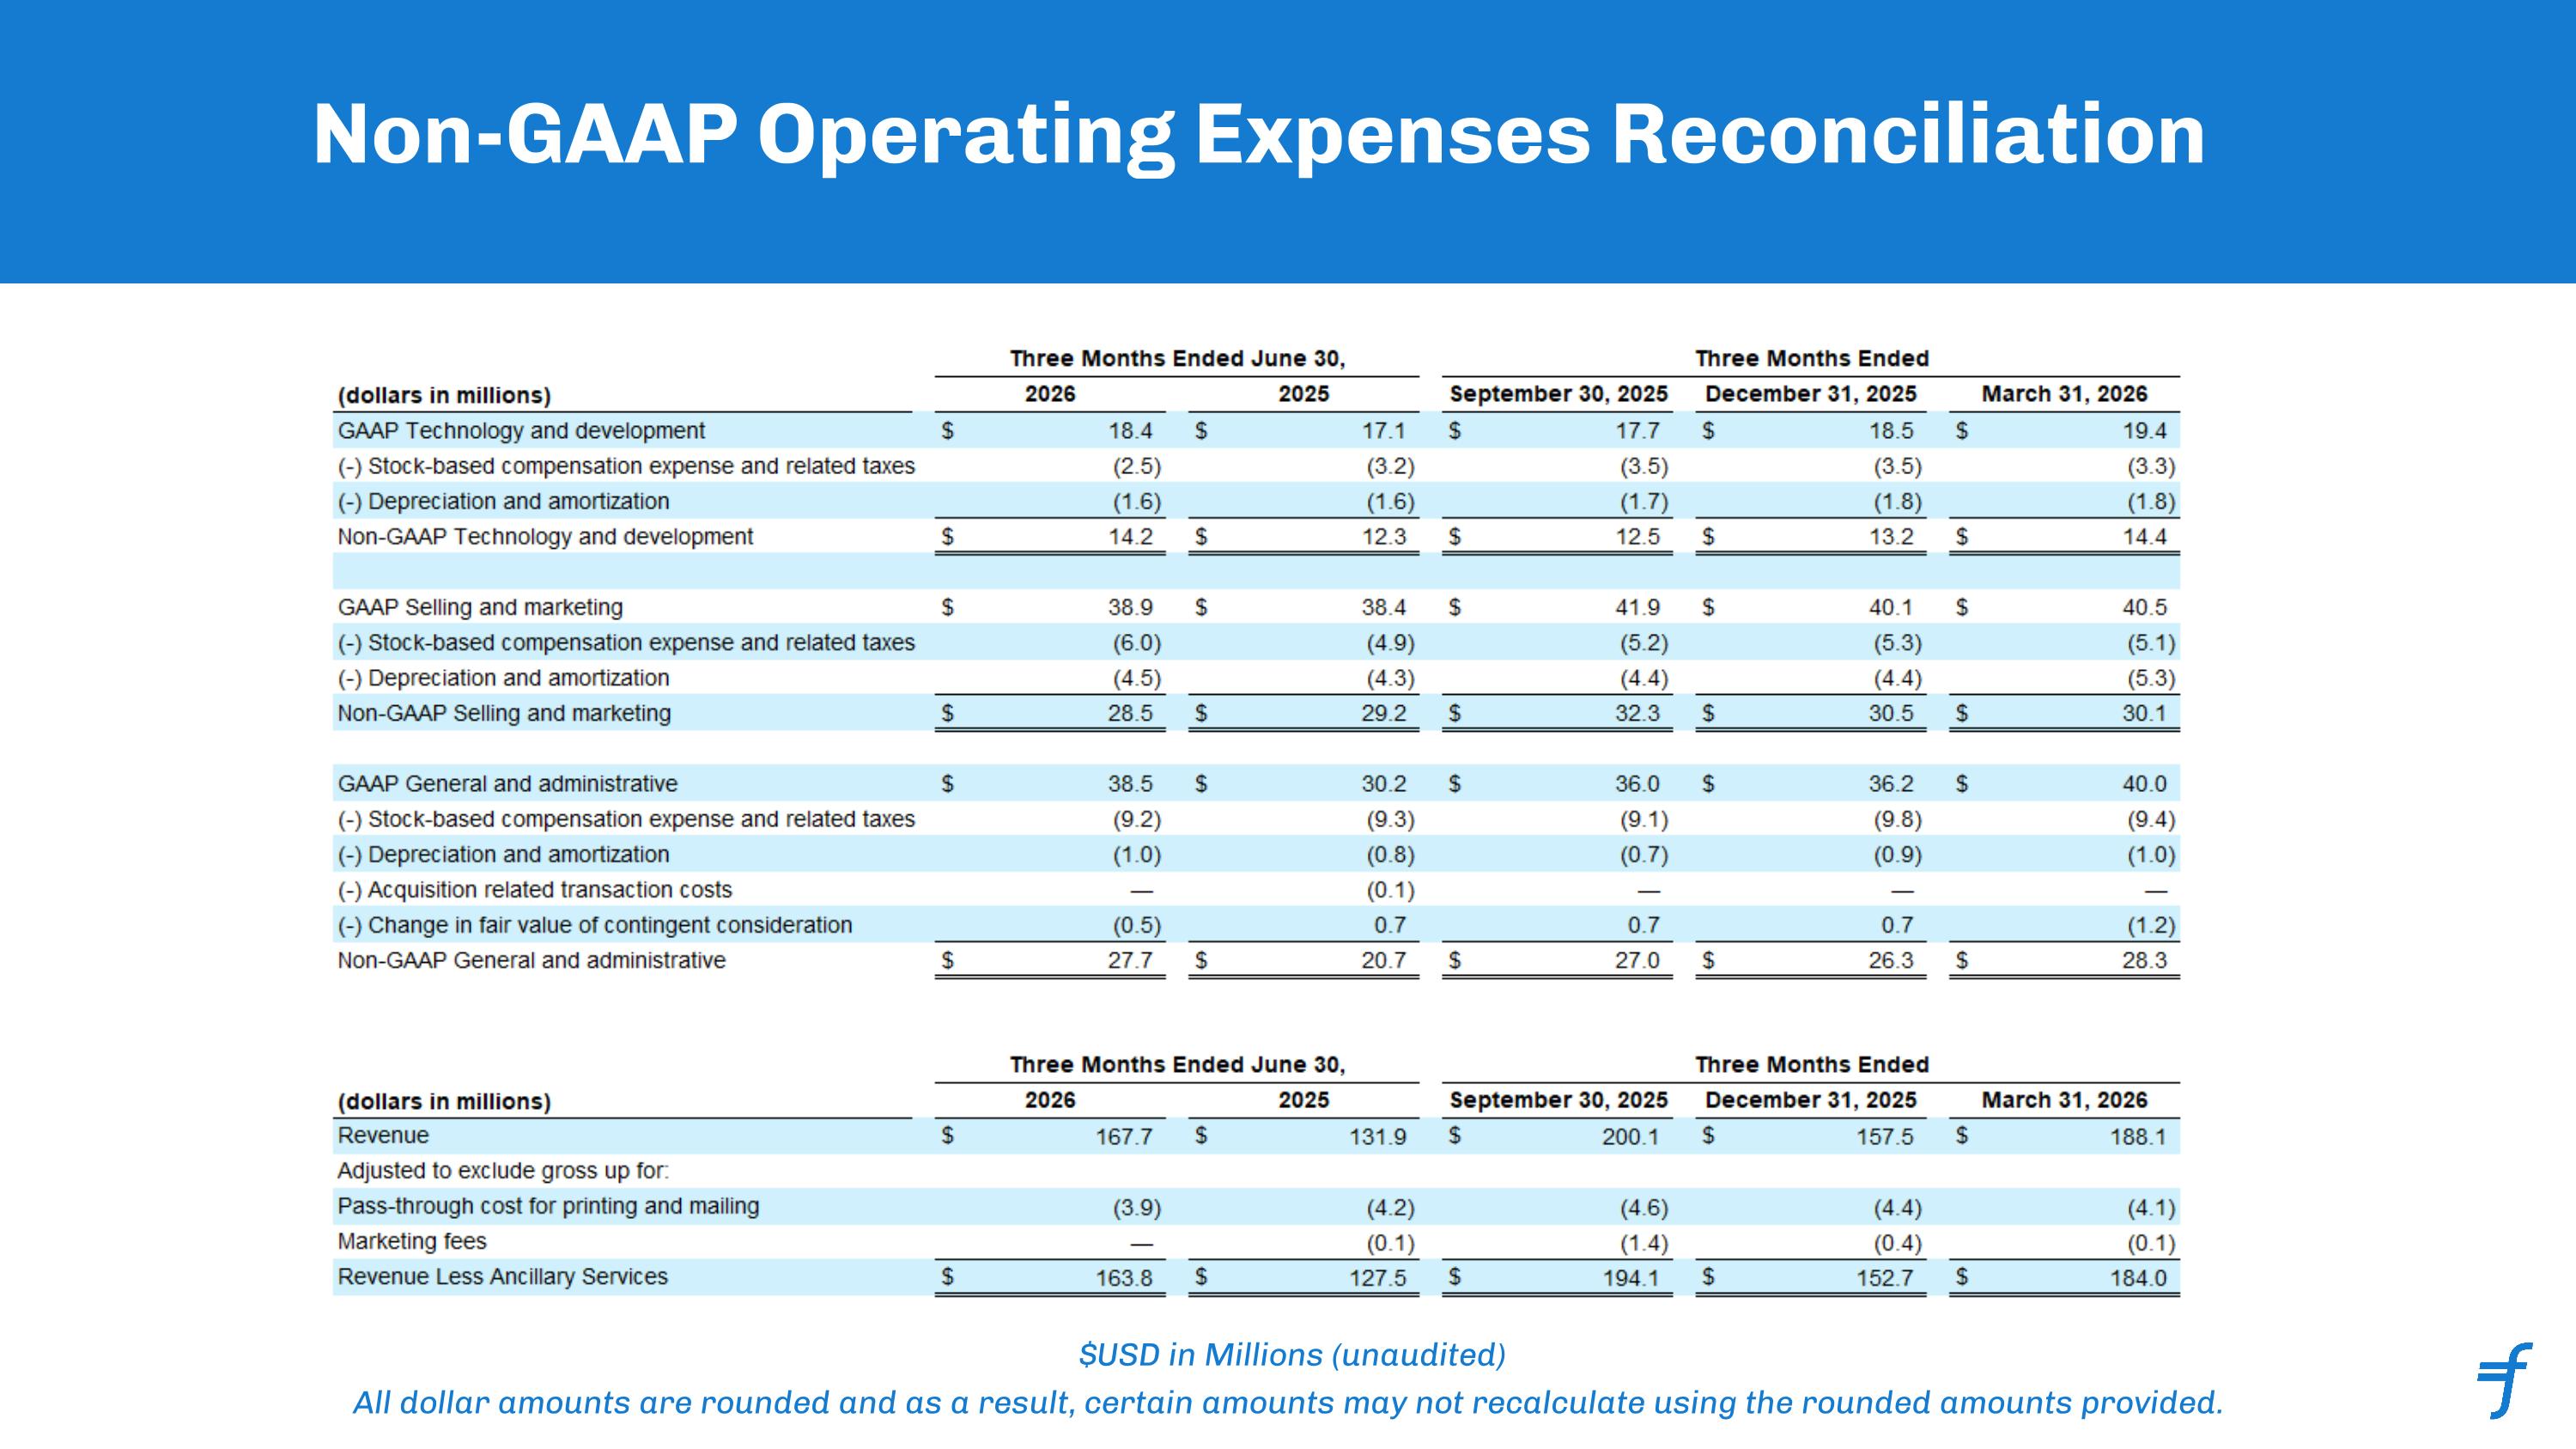
Non-GAAP Operating Expenses Reconciliation $USD in Millions (unaudited) All dollar amounts are rounded and as a result, certain amounts may not recalculate using the rounded amounts provided.
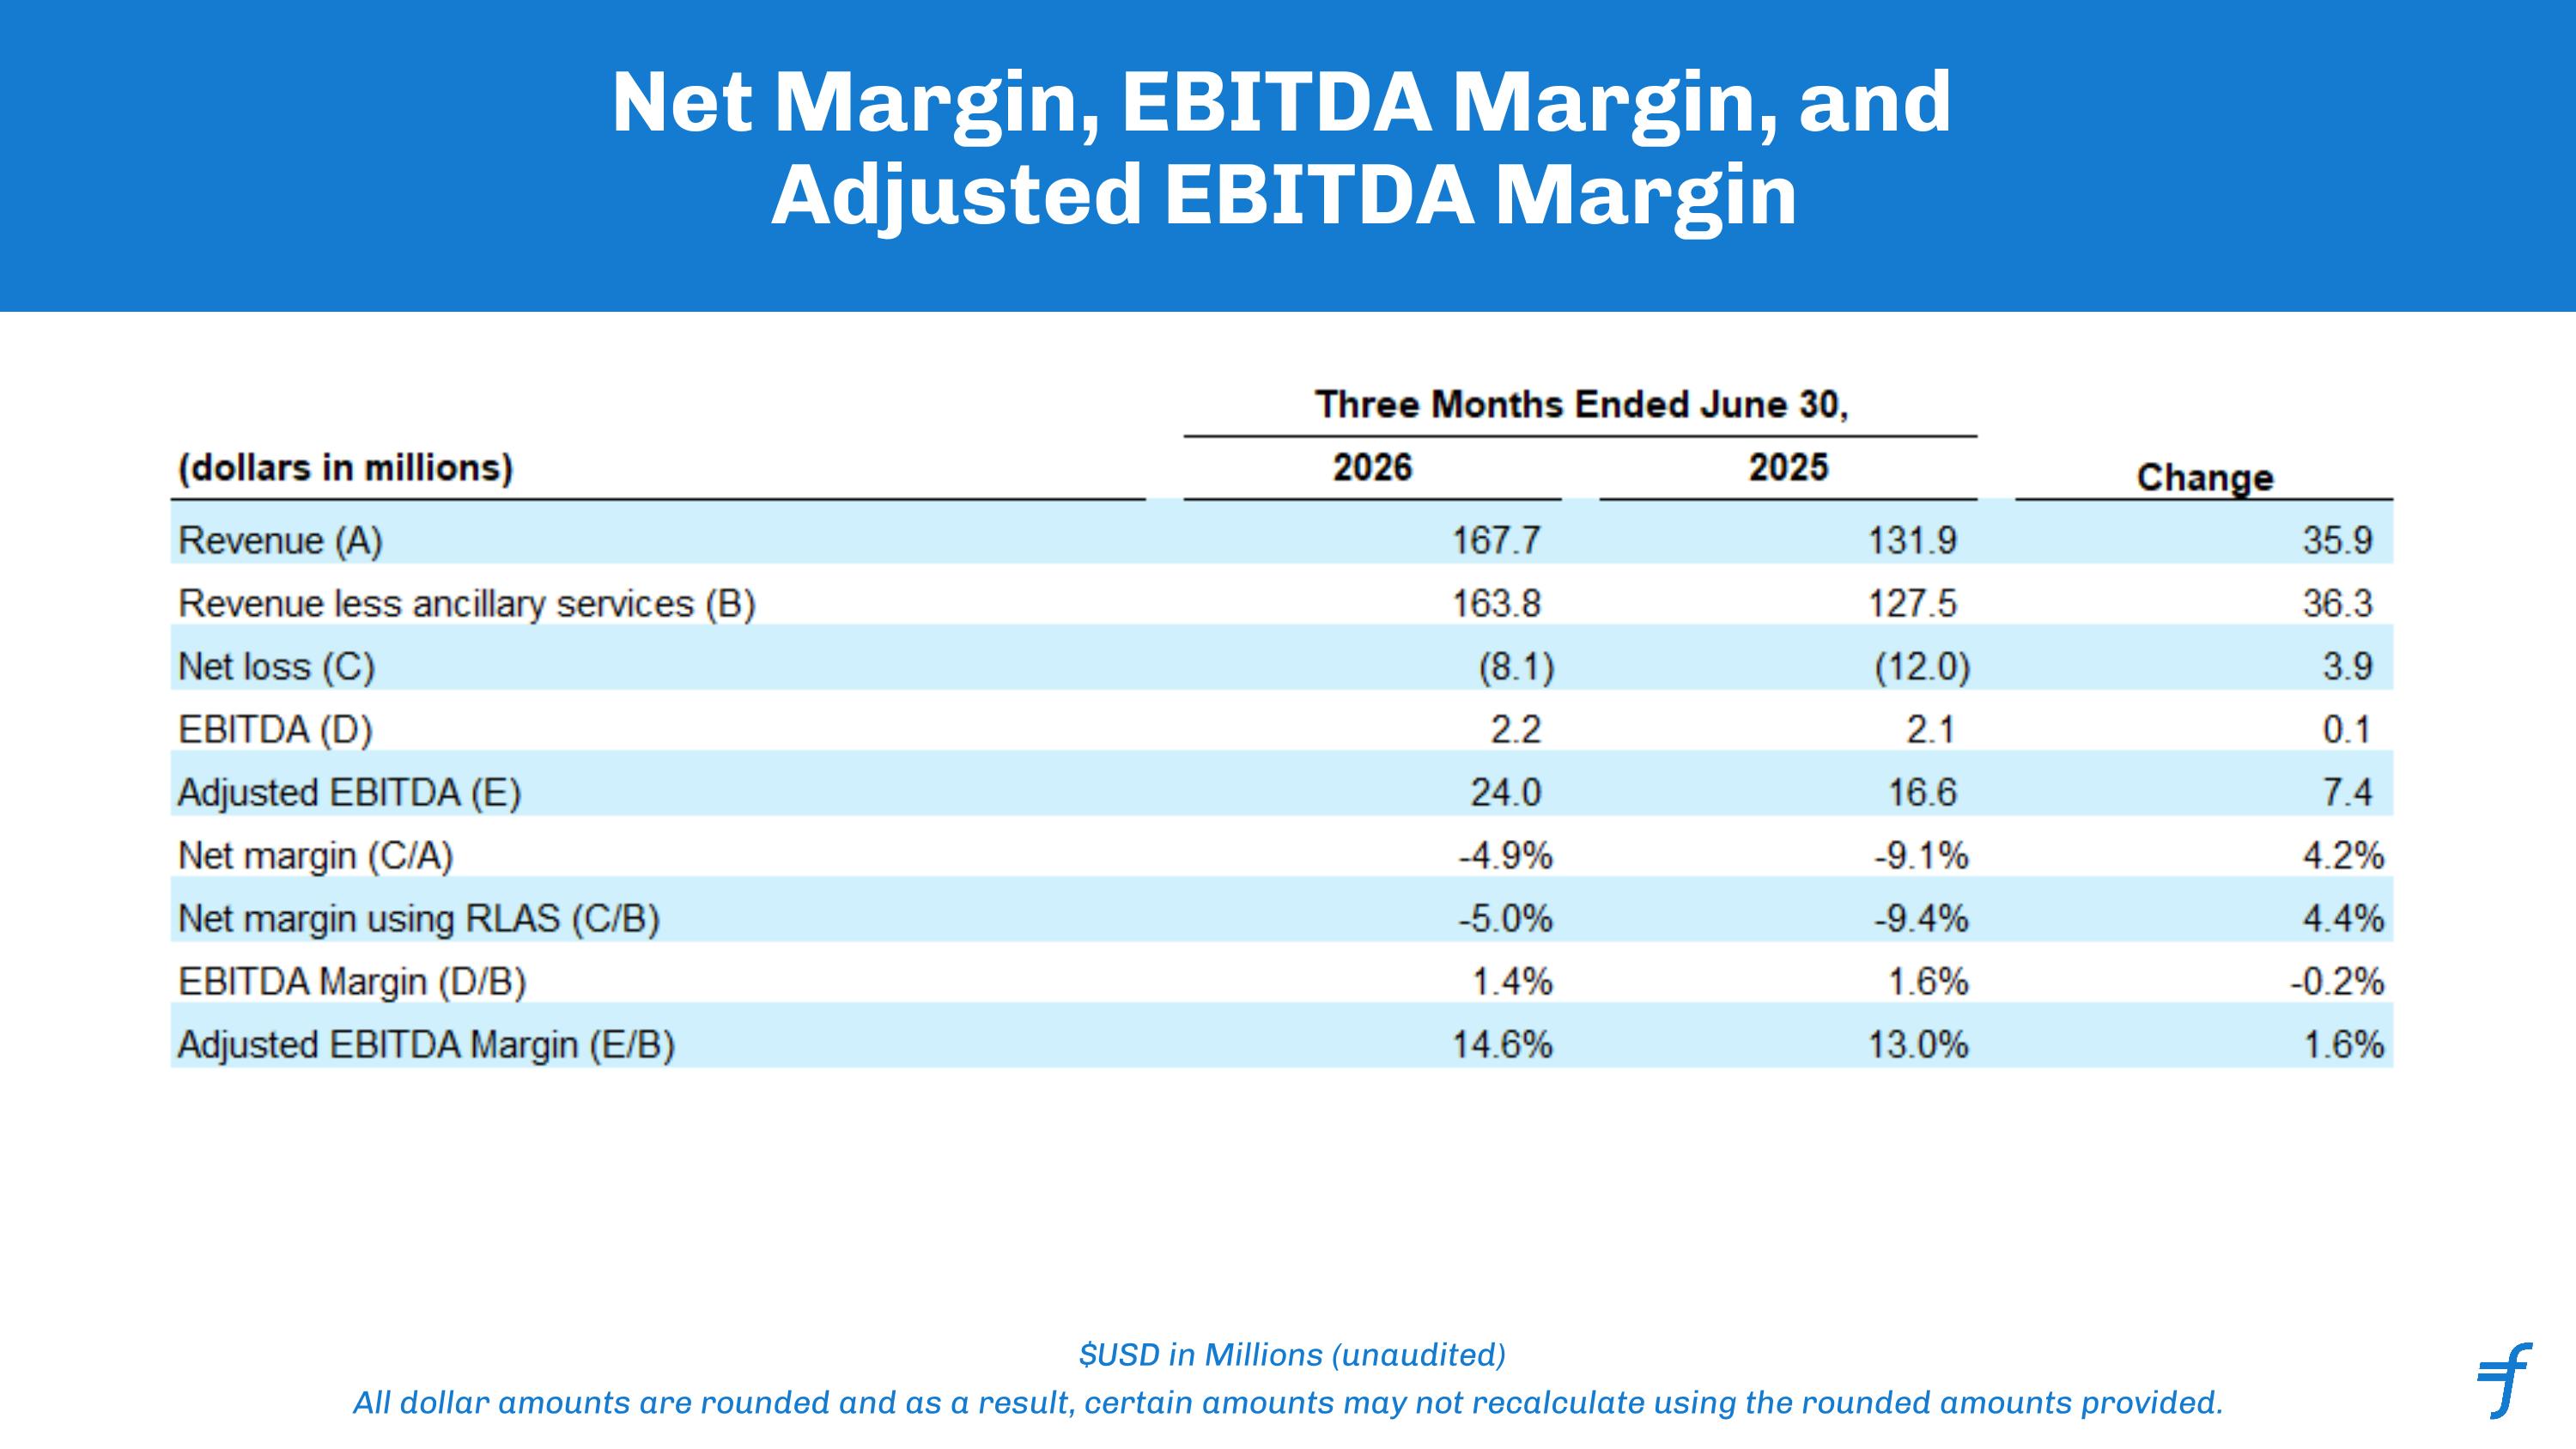
Net Margin, EBITDA Margin, and Adjusted EBITDA Margin $USD in Millions (unaudited) All dollar amounts are rounded and as a result, certain amounts may not recalculate using the rounded amounts provided.
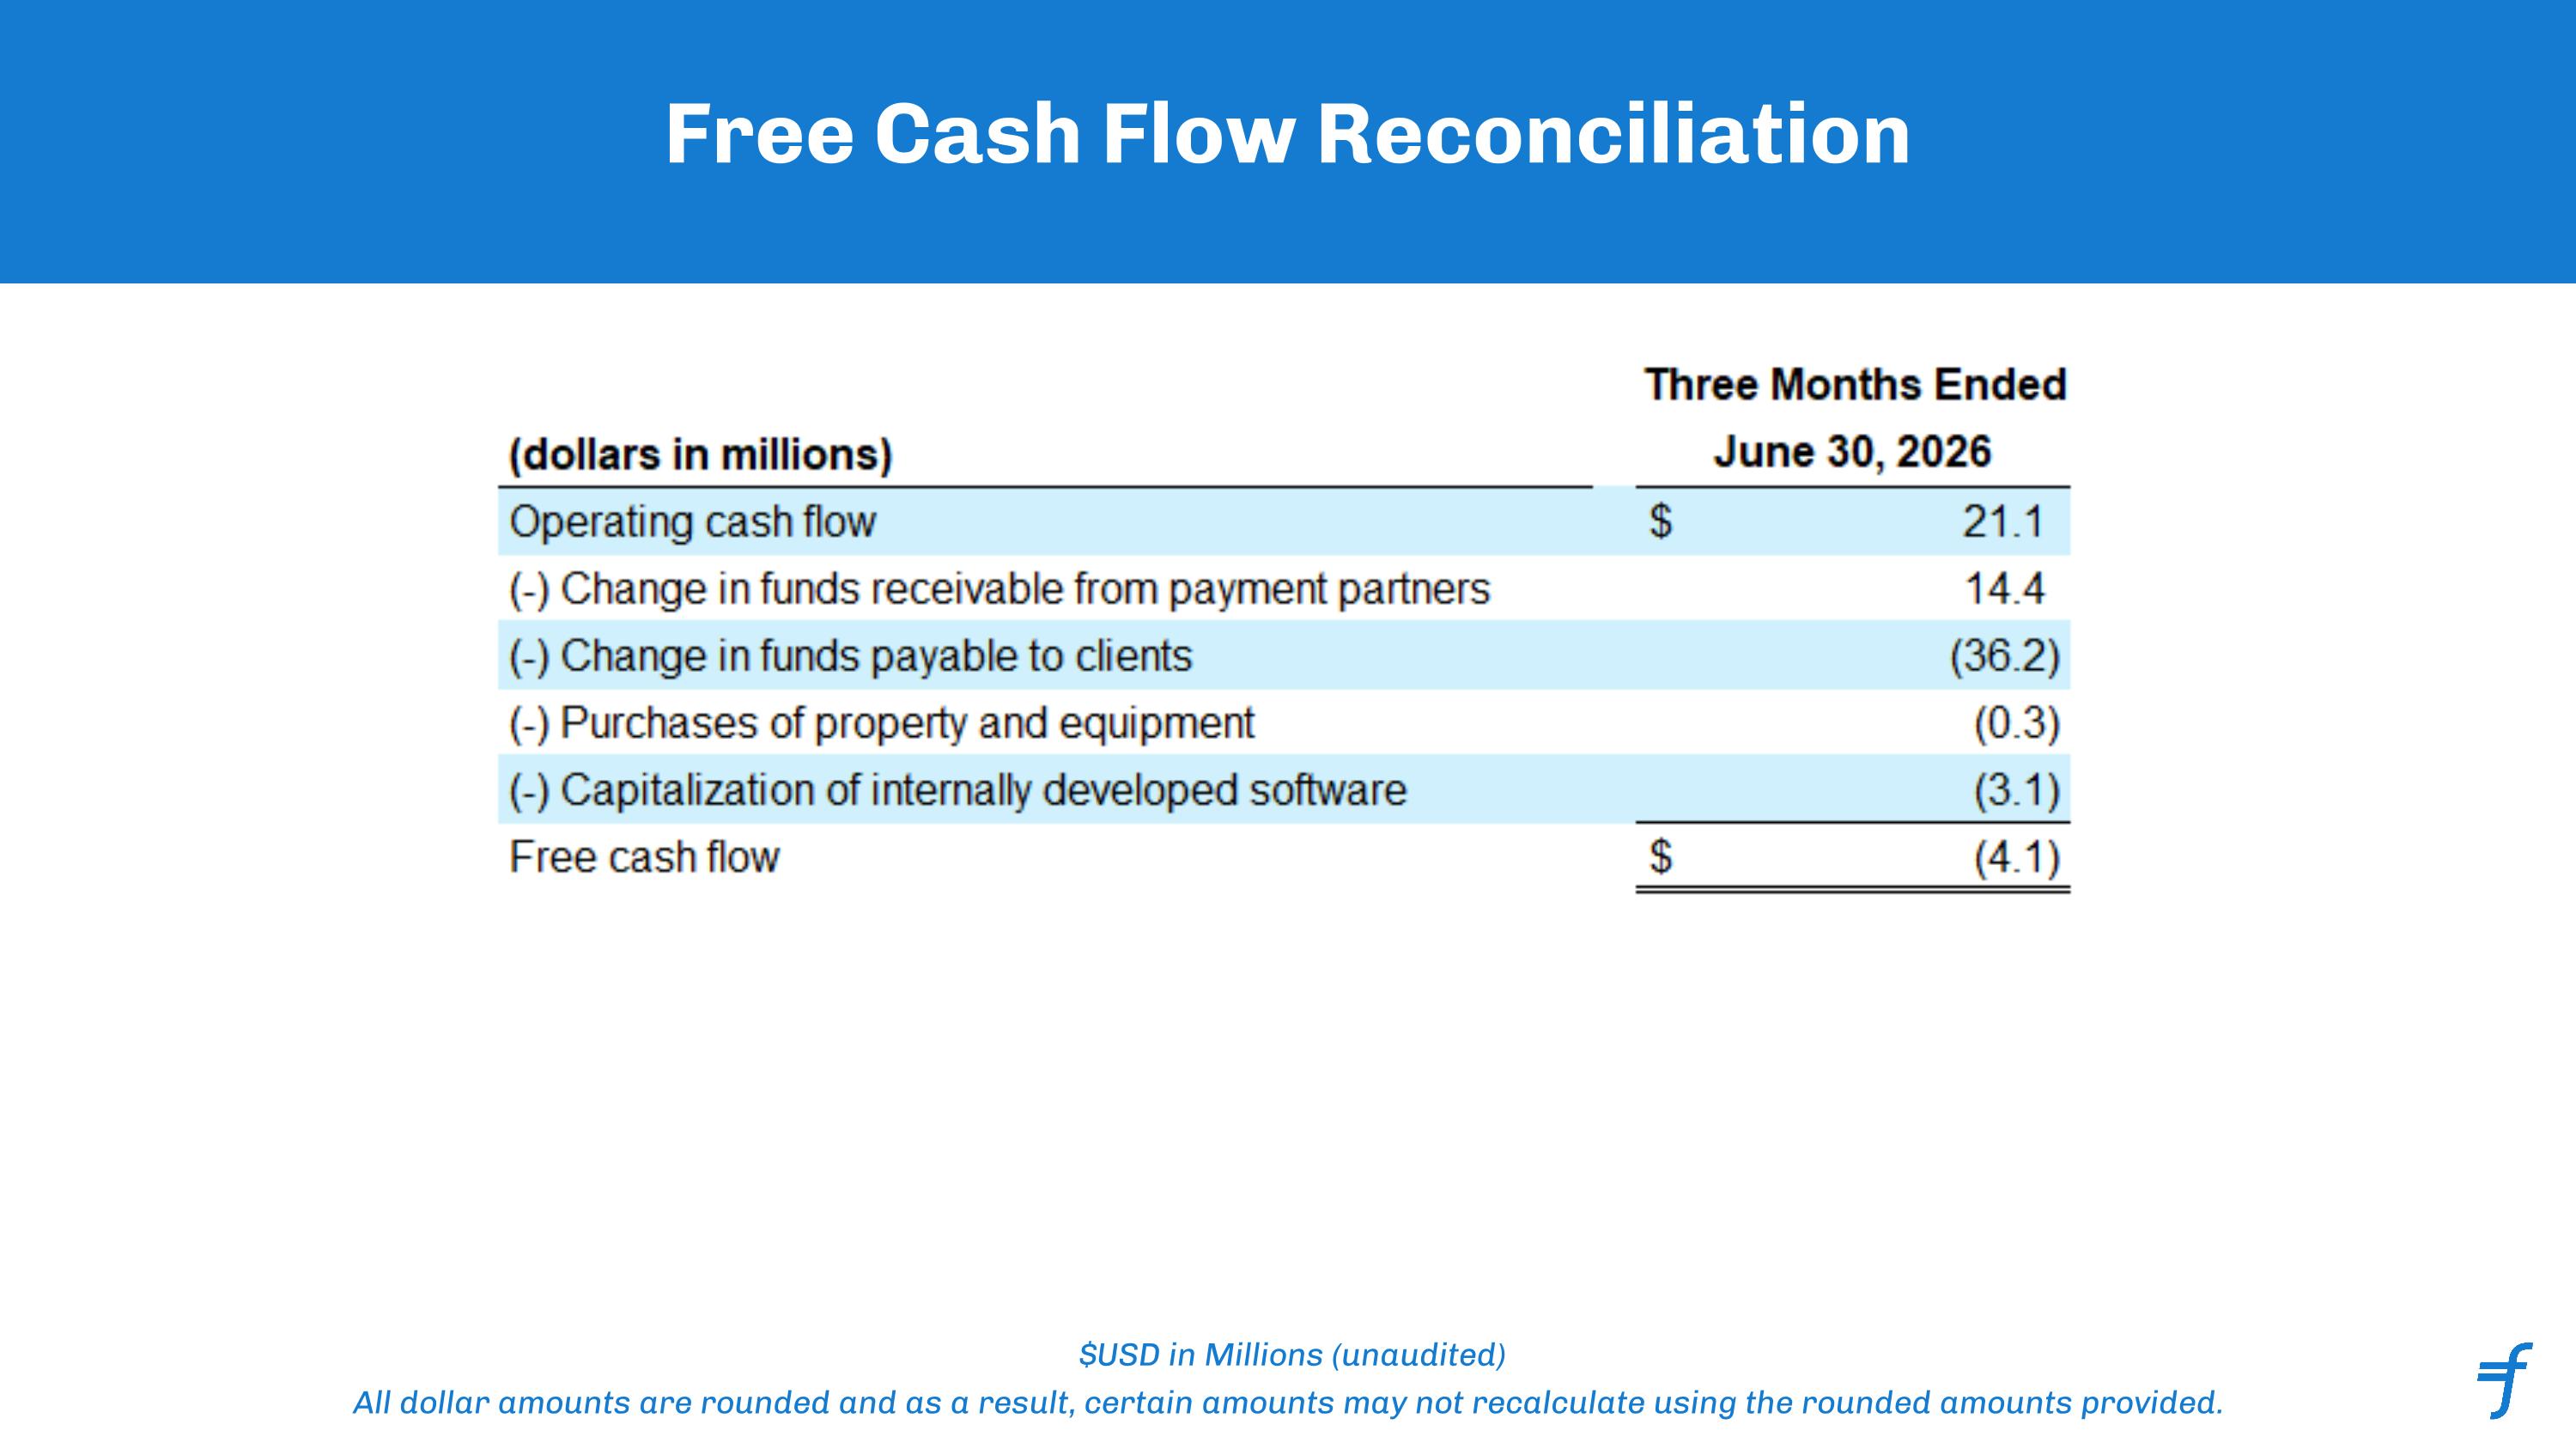
Free Cash Flow Reconciliation $USD in Millions (unaudited) All dollar amounts are rounded and as a result, certain amounts may not recalculate using the rounded amounts provided.
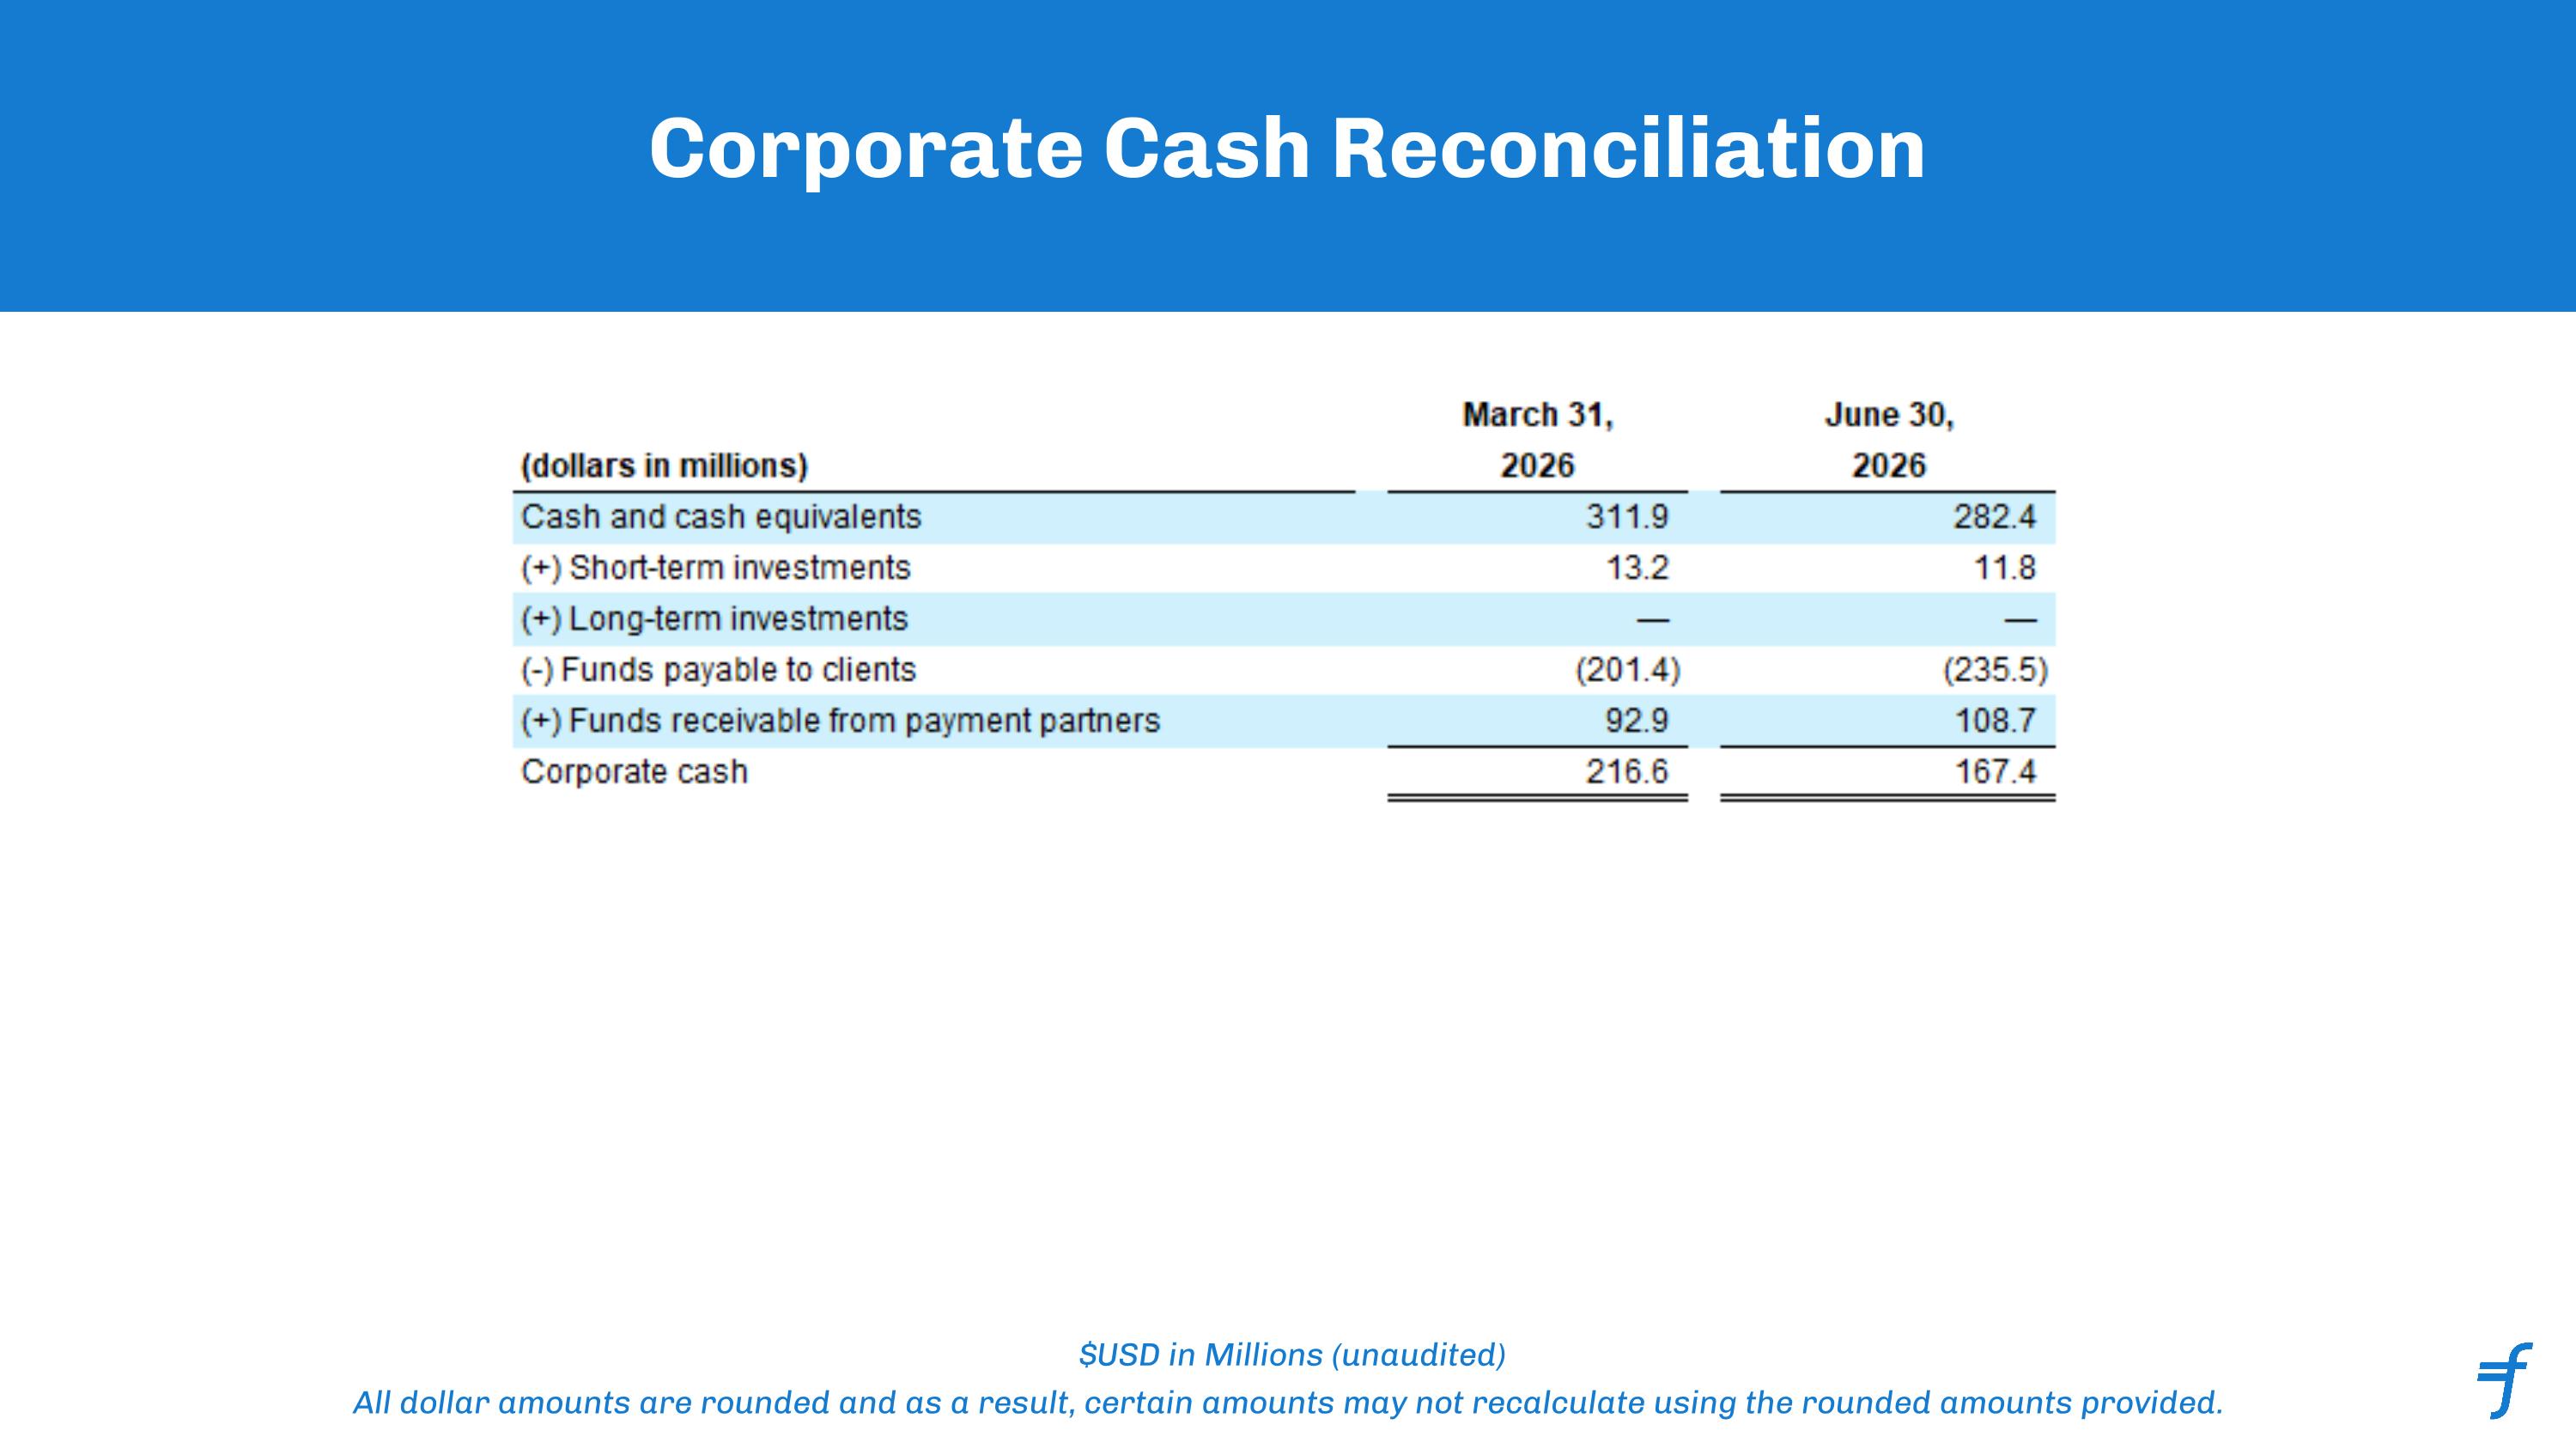
Corporate Cash Reconciliation $USD in Millions (unaudited) All dollar amounts are rounded and as a result, certain amounts may not recalculate using the rounded amounts provided.
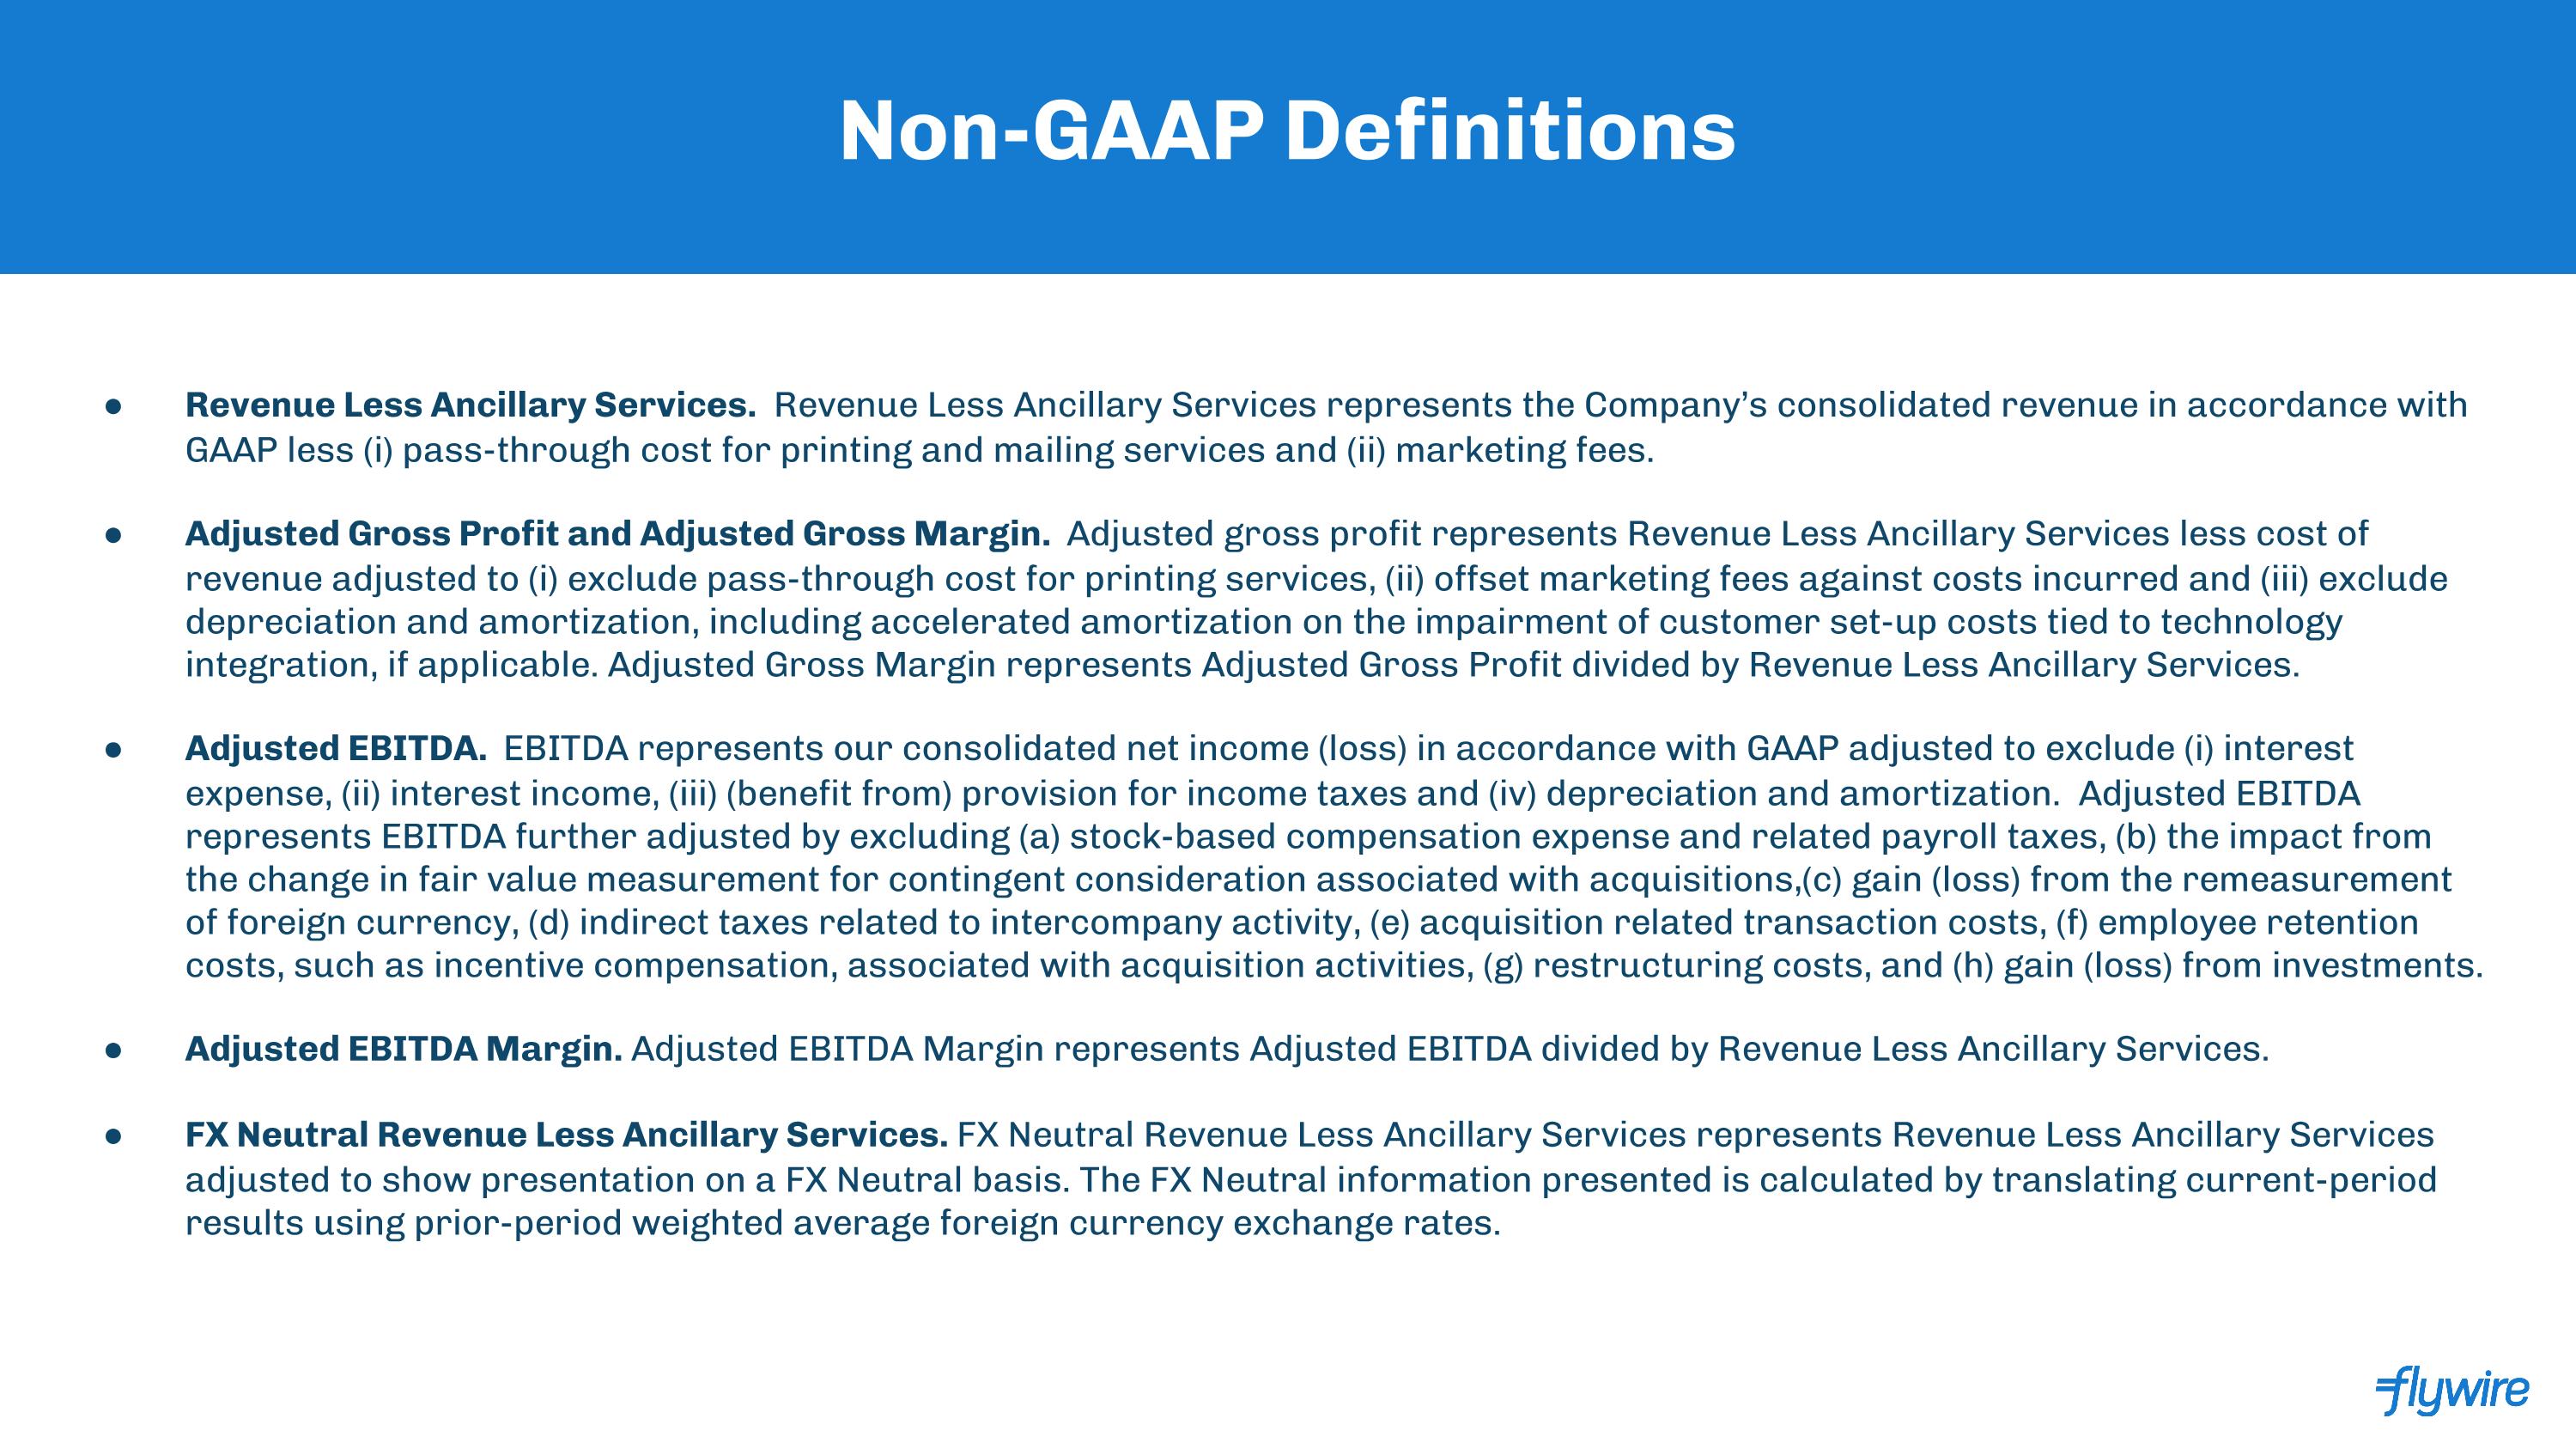
Non-GAAP Definitions Revenue Less Ancillary Services. Revenue Less Ancillary Services represents the Company’s consolidated revenue in accordance with GAAP less (i) pass-through cost for printing and mailing services and (ii) marketing fees. Adjusted Gross Profit and Adjusted Gross Margin. Adjusted gross profit represents Revenue Less Ancillary Services less cost of revenue adjusted to (i) exclude pass-through cost for printing services, (ii) offset marketing fees against costs incurred and (iii) exclude depreciation and amortization, including accelerated amortization on the impairment of customer set-up costs tied to technology integration, if applicable. Adjusted Gross Margin represents Adjusted Gross Profit divided by Revenue Less Ancillary Services. Adjusted EBITDA. EBITDA represents our consolidated net income (loss) in accordance with GAAP adjusted to exclude (i) interest expense, (ii) interest income, (iii) (benefit from) provision for income taxes and (iv) depreciation and amortization. Adjusted EBITDA represents EBITDA further adjusted by excluding (a) stock-based compensation expense and related payroll taxes, (b) the impact from the change in fair value measurement for contingent consideration associated with acquisitions,(c) gain (loss) from the remeasurement of foreign currency, (d) indirect taxes related to intercompany activity, (e) acquisition related transaction costs, (f) employee retention costs, such as incentive compensation, associated with acquisition activities, (g) restructuring costs, and (h) gain (loss) from investments. Adjusted EBITDA Margin. Adjusted EBITDA Margin represents Adjusted EBITDA divided by Revenue Less Ancillary Services. FX Neutral Revenue Less Ancillary Services. FX Neutral Revenue Less Ancillary Services represents Revenue Less Ancillary Services adjusted to show presentation on a FX Neutral basis. The FX Neutral information presented is calculated by translating current-period results using prior-period weighted average foreign currency exchange rates.
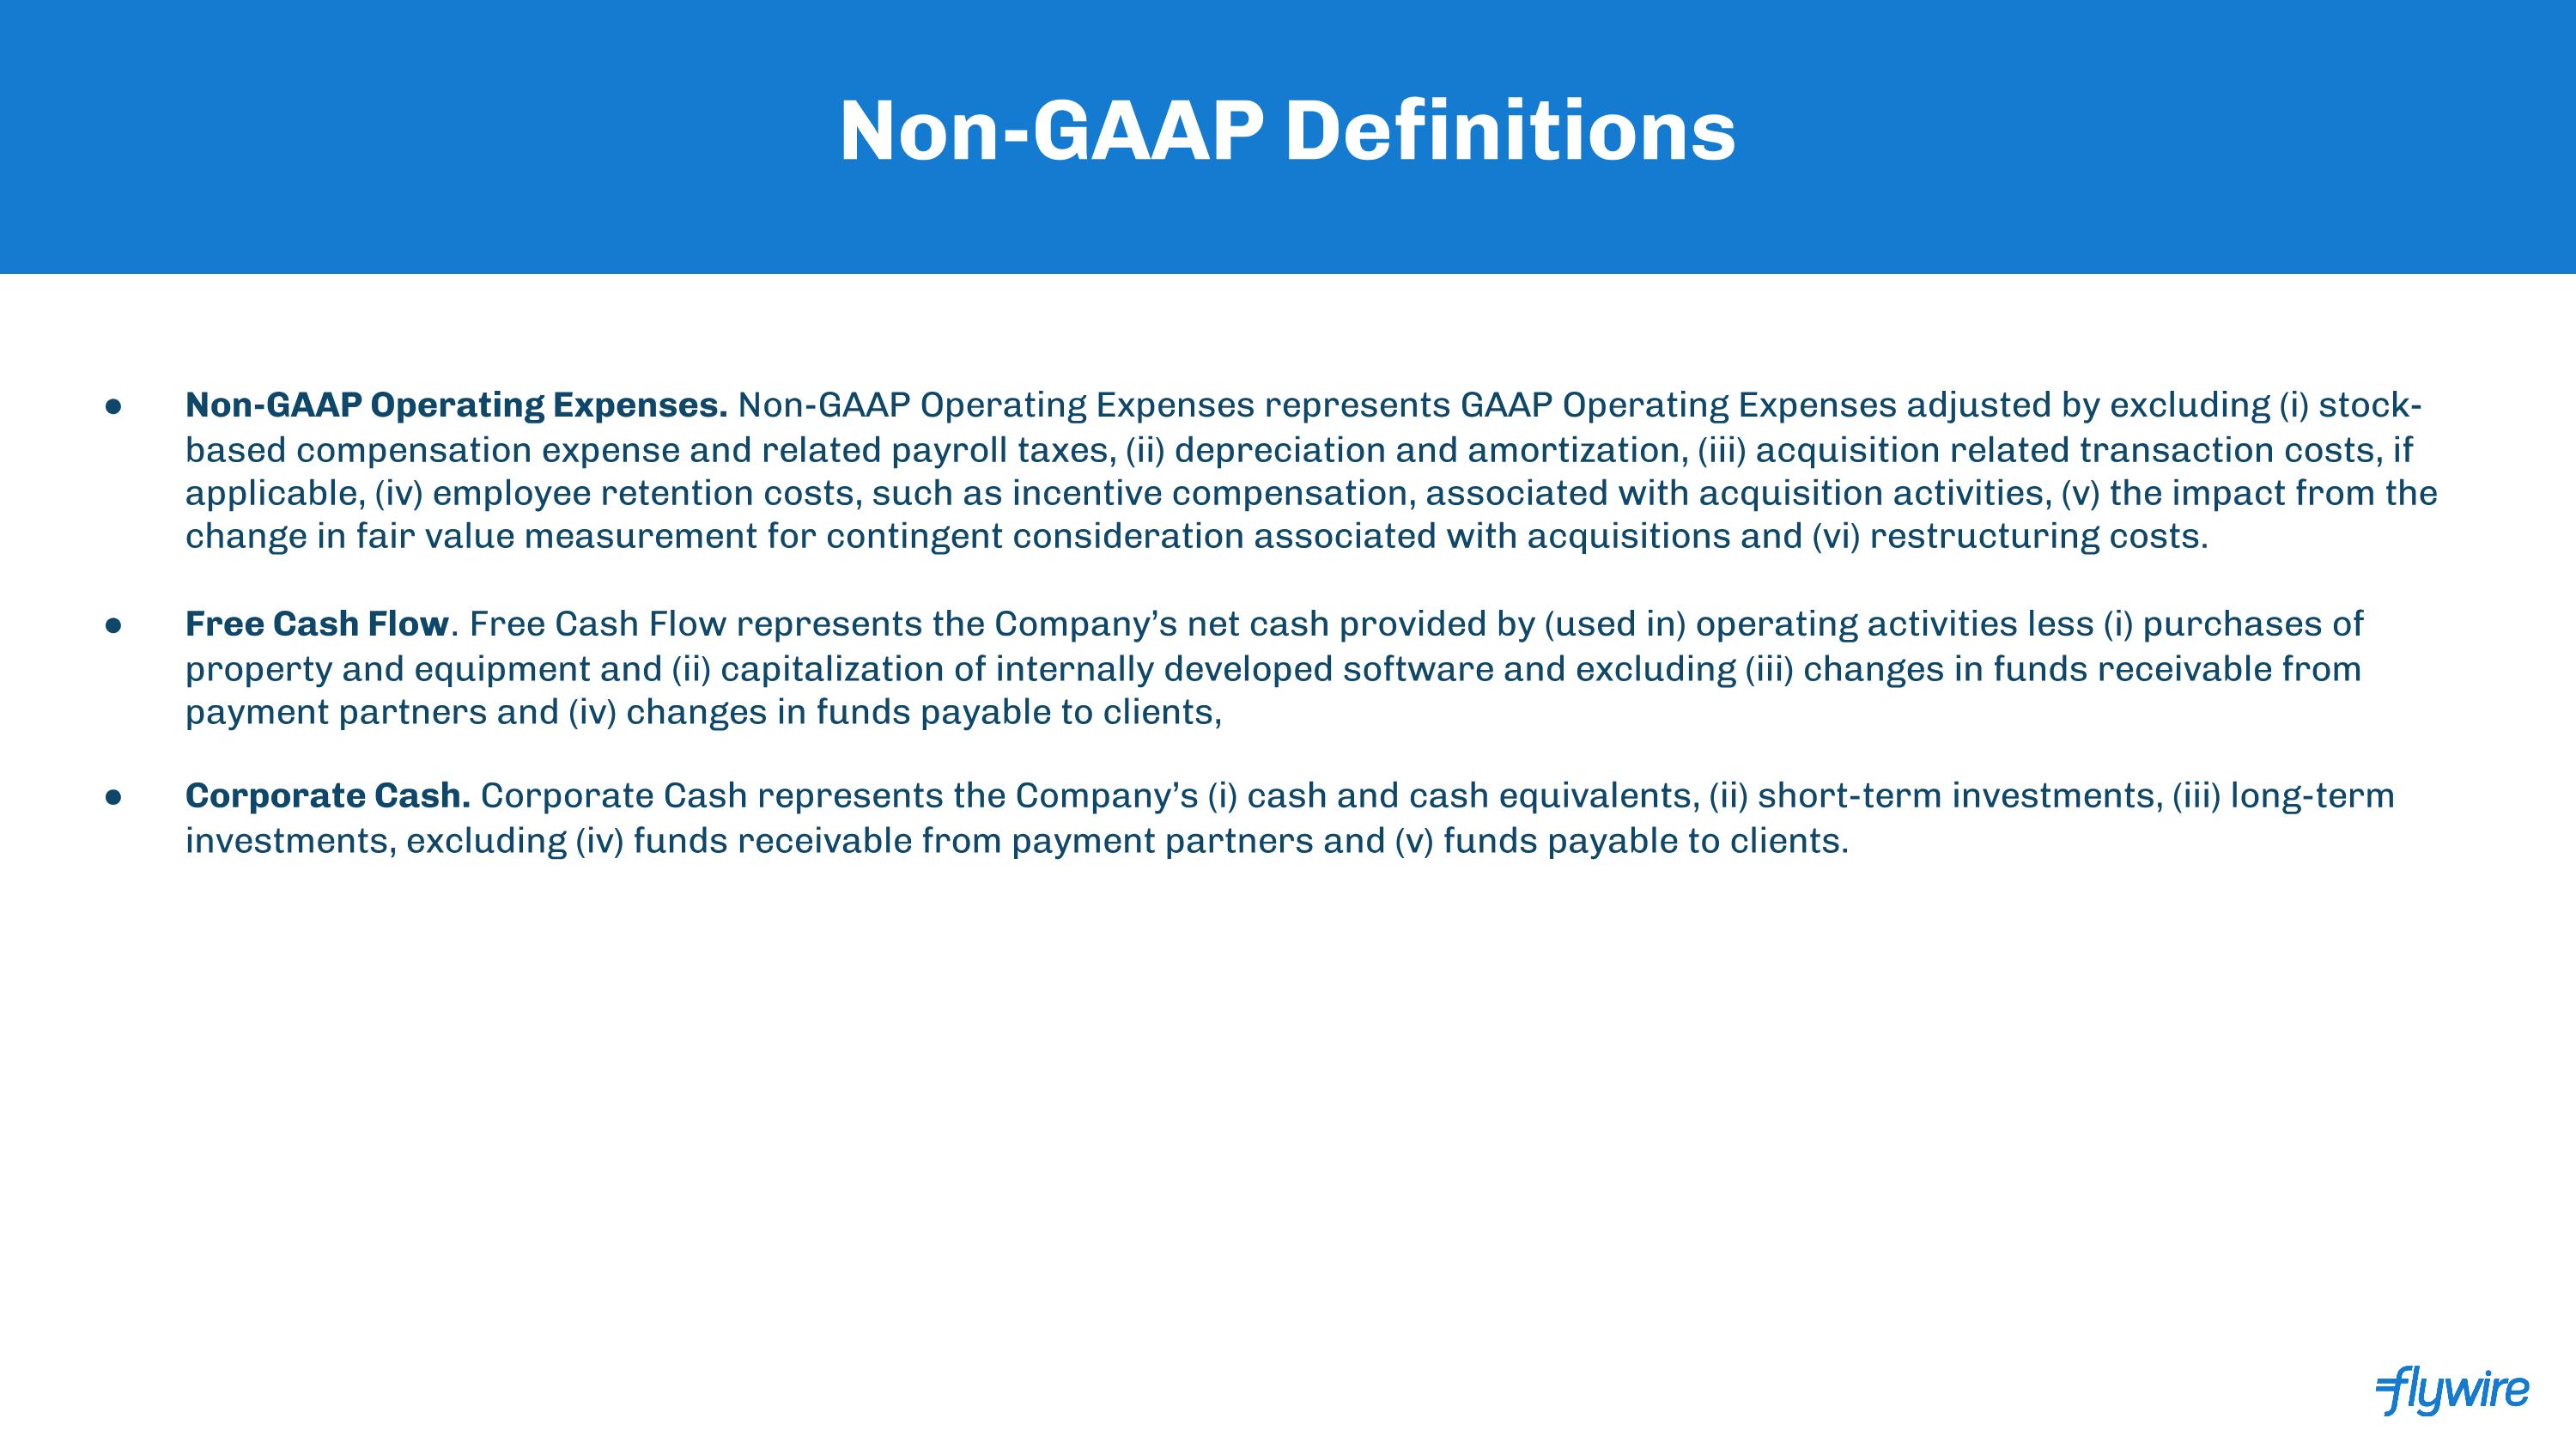
Non-GAAP Definitions Non-GAAP Operating Expenses. Non-GAAP Operating Expenses represents GAAP Operating Expenses adjusted by excluding (i) stock-based compensation expense and related payroll taxes, (ii) depreciation and amortization, (iii) acquisition related transaction costs, if applicable, (iv) employee retention costs, such as incentive compensation, associated with acquisition activities, (v) the impact from the change in fair value measurement for contingent consideration associated with acquisitions and (vi) restructuring costs. Free Cash Flow. Free Cash Flow represents the Company’s net cash provided by (used in) operating activities less (i) purchases of property and equipment and (ii) capitalization of internally developed software and excluding (iii) changes in funds receivable from payment partners and (iv) changes in funds payable to clients, Corporate Cash. Corporate Cash represents the Company’s (i) cash and cash equivalents, (ii) short-term investments, (iii) long-term investments, excluding (iv) funds receivable from payment partners and (v) funds payable to clients.