UNITED STATES
SECURITIES AND EXCHANGE COMMISSION
Washington, D.C. 20549
FORM
CURRENT REPORT
Pursuant to Section 13 or 15(d)
of the Securities Exchange Act of 1934
Date of Report (Date of earliest event reported):
(Exact name of Registrant as specified in its charter)
| (State or other jurisdiction of incorporation) |
(Commission File No.) |
(IRS Employer Identification No.) |
| (Address of principal executive offices and zip code) |
Registrant’s telephone number, including area code:
Not Applicable
(Former Name or Former Address, if Changed Since Last Report)
Check the appropriate box below if the Form 8-K filing is intended to simultaneously satisfy the filing obligation of the registrant under any of the following provisions:
| Written communications pursuant to Rule 425 under the Securities Act (17 CFR 230.425) |
| Soliciting material pursuant to Rule 14a-12 under the Exchange Act (17 CFR 240.14a-12) |
| Pre-commencement communications pursuant to Rule 14d-2(b) under the Exchange Act (17 CFR 240.14d-2(b)) |
| Pre-commencement communications pursuant to Rule 13e-4(c) under the Exchange Act (17 CFR 240.13e-4(c)) |
Securities registered pursuant to Section 12(b) of the Act:
| Title of each class |
Trading Symbol(s) |
Name of each exchange on which registered | ||
| (Nasdaq Global Select Market) |
Indicate by check mark whether the registrant is an emerging growth company as defined in Rule 405 of the Securities Act of 1933 (§230.405 of this chapter) or Rule 12b-2 of the Securities Exchange Act of 1934 (§240.12b-2 of this chapter).
Emerging growth company
If an emerging growth company, indicate by check mark if the registrant has elected not to use the extended transition period for complying with any new or revised financial accounting standards provided pursuant to Section 13(a) of the Exchange Act. ☐
| Item 2.02. | Results of Operations and Financial Condition. |
On May 6, 2025, Flywire Corporation (“Flywire” or the “Company”) issued a press release (the “Press Release”) and is holding a conference call regarding its preliminary and unaudited financial results for the quarter ended March 31, 2025. The Press Release is furnished as Exhibit 99.1 to this Current Report on Form 8-K and is incorporated by reference herein.
Various statements to be made during the conference call are “forward-looking statements” within the meaning of the Private Securities Litigation Reform Act of 1995, including, but not limited to, statements regarding Flywire’s future operating results and financial position, Flywire’s business strategy and plans, market growth, and Flywire’s objectives for future operations. Flywire intends such forward-looking statements to be covered by the safe harbor provisions for forward-looking statements contained in Section 21E of the Securities Exchange Act of 1934 and the Private Securities Litigation Reform Act of 1995. In some cases, you can identify forward-looking statements by terms such as, but not limited to, “believe,” “may,” “will,” “potentially,” “estimate,” “continue,” “anticipate,” “intend,” “could,” “would,” “project,” “target,” “plan,” “expect,” or the negative of these terms, and similar expressions intended to identify forward-looking statements. Such forward-looking statements are based upon current expectations that involve risks, changes in circumstances, assumptions, and uncertainties. Important factors that could cause actual results to differ materially from those reflected in Flywire’s forward-looking statements include, among others, Flywire’s future financial performance, including its expectations regarding FX Neutral Revenue Less Ancillary Services growth, and Adjusted EBITDA margin growth and foreign exchange rates. Risks that may cause actual results to differ materially from these forward looking statements include, but are not limited to: Flywire’s ability to execute its business plan and effectively manage its growth; Flywire’s cross-border expansion plans and ability to expand internationally; anticipated trends, growth rates, and challenges in Flywire’s business and in the markets in which Flywire operates; the sufficiency of Flywire’s cash and cash equivalents to meet its liquidity needs; political, economic, foreign currency exchange rate, inflation, legal, social and health risks, that may affect Flywire’s business or the global economy; Flywire’s beliefs and objectives for future operations; Flywire’s ability to develop and protect its brand; Flywire’s ability to maintain and grow the payment volume that it processes; Flywire’s ability to further attract, retain, and expand its client base; Flywire’s ability to develop new solutions and services and bring them to market in a timely manner; Flywire’s expectations concerning relationships with third parties, including financial institutions and strategic partners; the effects of increased competition in Flywire’s markets and its ability to compete effectively; recent and future acquisitions or investments in complementary companies, products, services, or technologies; Flywire’s ability to enter new client verticals, including its relatively new business-to-business sector; Flywire’s expectations regarding anticipated technology needs and developments and its ability to address those needs and developments with its solutions; Flywire’s expectations regarding its ability to meet existing performance obligations and maintain the operability of its solutions; Flywire’s expectations regarding the effects of existing and developing laws and regulations, including with respect to payments and financial services, taxation, privacy and data protection; Flywire’s ability to adapt its business to changes in government policy regarding tariffs and immigration; economic and industry trends, including the risk of a global recession, projected growth, or trend analysis; the effects of global events and geopolitical conflicts, including without limitation the continuing hostilities in Ukraine and involving Israel; Flywire’s ability to adapt to changes in U.S. federal income or other tax laws or the interpretation of tax laws, including the Inflation Reduction Act of 2022; Flywire’s ability to attract and retain qualified employees; Flywire’s ability to maintain, protect, and enhance its intellectual property; Flywire’s ability to maintain the security and availability of its solutions; the increased expenses associated with being a public company; the future market price of Flywire’s common stock; and other factors that are described in the “Risk Factors” and “Management’s Discussion and Analysis of Financial Condition and Results of Operations” sections of Flywire’s Annual Report on Form 10-K for the year ended December 31, 2024 which is on file with the Securities and Exchange Commission (SEC) and available on the SEC’s website at https://www.sec.gov/. Additional factors may be described in those sections of Flywire’s Quarterly Report on Form 10-Q for the quarter ended March 31, 2025, expected to be filed in the second quarter of 2025.The information conveyed on the conference call is provided only as of the date of the conference call, and Flywire undertakes no obligation to update any forward-looking statements presented during the conference call on account of new information, future events, or otherwise, except as required by law.
| Item 7.01. | Regulation FD Disclosure. |
On May 6, 2025, the Company provided an investor presentation that will be made available on the investor relations section of the Company’s website at https://ir.flywire.com/. The investor presentation is furnished as Exhibit 99.2 to this Current Report on Form 8-K and is incorporated by reference herein.
This information in this Item 7.01 of this Current Report on Form 8-K shall not be deemed “filed” for purposes of Section 18 of the Securities Exchange Act of 1934, as amended (the “Exchange Act”), or otherwise subject to the liabilities of that Section, or incorporated by reference in any filing under the Securities Act of 1933, as amended, or the Exchange Act, except as shall be expressly set forth by specific reference in any such filing.
| Item 9.01. | Financial Statements and Exhibits. |
(d) Exhibits
| Exhibit No. |
Description | |
| 99.1 | Flywire Corporation Press Release dated May 6, 2025. | |
| 99.2 | Flywire Corporation Investor Presentation dated May 6, 2025. | |
| 104 | Cover Page Interactive Data File (embedded within the Inline XBRL document) | |
SIGNATURE
Pursuant to the requirements of the Securities Exchange Act of 1934, the registrant has duly caused this report to be signed on its behalf by the undersigned hereunto duly authorized.
| FLYWIRE CORPORATION | ||
| By: | /s/ Cosmin Pitigoi | |
| Name: | Cosmin Pitigoi | |
| Title: | Chief Financial Officer | |
Dated May 6, 2025
Exhibit 99.1
Flywire Reports First Quarter 2025 Financial Results
First Quarter Revenue Increased 17.0% Year-over-Year
First Quarter Revenue Less Ancillary Services Increased 16.8% Year-over-Year
Previous Fiscal Year 2025 guidance reaffirmed
Boston, MA – May 6, 2025: Flywire Corporation (Nasdaq: FLYW) (“Flywire” or the “Company”), a global payments enablement and software company, today reported financial results for its first quarter ended March 31, 2025.
“We are pleased with our 2025 first quarter results, as we signed more than 200 new clients, led by our Travel and Education verticals, and exceeded the high end of our FX Neutral Revenue Guidance, while expanding Adjusted EBITDA margins above our guidance mid-point,” said Mike Massaro, CEO of Flywire. “This solid start to our year reflects ongoing sales momentum, the strength and resilience of our global and diversified business, as well as strategic changes that came out of our operational review tied to capital allocation and performance culture. Importantly, our core business is thriving, showing low client churn and clear evidence that our clients deeply value our services.”
“Looking ahead, we plan to continue to make strategic and operational decisions to support our clients and position us for even greater strength and long-term success, while investing and optimizing the business to emerge even stronger as we exit the year.”
First Quarter 2025 Financial Highlights:
GAAP Results
| • | Revenue increased 17.0% to $133.5 million in the First quarter of 2025, compared to $114.1 million in the First quarter of 2024. Sertifi positively impacted revenue by $4.7 million in the First quarter of 2025 or 4.1% year over year. |
| • | Gross Profit increased to $80.5 million, resulting in Gross Margin of 60.3%, for the First quarter of 2025, compared to Gross Profit of $70.4 million and Gross Margin of 61.7% in the First quarter of 2024. |
| • | Net loss was ($4.2) million in the First quarter of 2025, compared to net loss of ($6.2) million in the First quarter of 2024. |
Key Business Performance highlights:
| • | Signed more than 200 new clients across all verticals. |
| • | Scaled the fast-growing Travel vertical, adding key clients like Haman Group, Scandinavia’s largest inbound tour operator, and expanding Sertifi solutions across leading hotel brands and multinational hospitality management companies. |
| • | Appointed a Chief Payments Officer to accelerate product and payment innovation. |
| • | Expanded our footprint in India, partnering with the second-largest non-banking financial company in India (Avanse) and India’s largest public sector bank (State Bank of India) to capitalize on the billion dollars of payment volume from education loans. |
| • | Strengthened our software integrations with leading ERPs for the higher education industry, including Ellucian, Workday, and Unit4. |
| • | More than $2 billion in 529 tuition payments were delivered directly to colleges and universities in the U.S. using our platform in 2024, benefitting more than 750 U.S. institutions. |
Key Operating Metrics and Non-GAAP Results
| • | Total Payment Volume increased 20.4% to $8.4 billion in the First quarter of 2025, compared to $7.0 billion in the First quarter of 2024. Excluding Sertifi, Total Payment Volume increased 19.1% to $8.3 billion in the First quarter of 2025, compared to $7.0 billion in the First quarter of 2024. |
| • | Revenue Less Ancillary Services increased 16.8% to $128.7 million in the First quarter of 2025, compared to $110.2 million in the First quarter of 2024. On an FX-neutral basis, Revenue Less Ancillary Services increased 18.6% year-over-year. Excluding Sertifi, Revenue Less Ancillary Services increased 12.6% year over year to $124 million or 14.4% year over year on an FX-Neutral basis in the First quarter of 2025. |
| • | Adjusted Gross Profit increased to $82.5 million, up 14.6% compared to $71.9 million in the First quarter of 2024. Adjusted Gross Margin was 64.1% in the First quarter of 2025 compared to 65.2% in the First quarter of 2024. |
| • | Adjusted EBITDA increased to $21.6 million in the First quarter of 2025, compared to $13.2 million in the First quarter of 2024. Our adjusted EBITDA margins increased 476 bps year-over-year to 16.8% in the First quarter of 2025. Excluding Sertifi, adjusted EBITDA was $20.6 million compared to $13.2 million in the First quarter of 2024. |
| • | We repurchased 3.6 million shares of our common stock for approximately $49 million (including commissions), with approximately $57 million remaining in the share repurchase program as of the end of the First quarter 2025 |
Guidance
”First quarter 2025 performance meaningfully beat across both FX Neutral Revenue Growth and Adjusted EBITDA Margin Growth, as we’re driving revenue growth and margin expansion through effective execution, with a sharp focus on strategic investments and operational efficiency,” said Flywire’s CFO, Cosmin Pitigoi. “This approach is enabling us to win new clients, particularly in our key travel and education verticals, while maintaining our full-year 2025 financial outlook despite macroeconomic challenges.”
Based on information available as of May 6, 2025, Flywire anticipates the following results for the second quarter and fiscal year 2025*.
| Fiscal Year 2025 | ||
| FX-Neutral Revenue Less Ancillary Services Growth |
17-23% YoY | |
| FX-Neutral Revenue Less Ancillary Services Growth (excluding Sertifi) |
10-14% YoY | |
| Sertifi Revenue contribution1 |
$35-40M | |
| Adjusted EBITDA Margin Growth |
+100-300 bps YoY |
| 1 | Since the acquisition closed on 02/24/2025. |
| Second Quarter 2025 | ||
| FX-Neutral Revenue Less Ancillary Services Growth |
17-23% YoY | |
| FX-Neutral Revenue Less Ancillary Services Growth (excluding Sertifi) |
7-11% YoY | |
| Sertifi Revenue contribution |
$10-12M | |
| Adjusted EBITDA Margin Growth |
+150-350 bps YoY |
| * | Flywire has not provided a quantitative reconciliation of forecasted FX-Neutral Revenue Less Ancillary Services Growth to forecasted GAAP Revenue Growth or forecasted Adjusted EBITDA Margin Growth to forecasted GAAP Net Income Margin Growth or to forecasted GAAP net income (loss) before income taxes within this earnings release because Flywire is unable, without making unreasonable efforts, to calculate certain reconciling items with confidence. These items include, but are not limited to, income taxes, which are directly impacted by unpredictable fluctuations in the market price of Flywire’s stock and foreign currency exchange rates. |
These statements are forward-looking, and actual results may differ materially. Refer to the “Safe Harbor Statement” below for information on the factors that could cause Flywire’s actual results to differ materially from these forward-looking statements.
Conference Call
The Company will host a conference call to discuss First quarter financial results today at 5:00 pm ET. Hosting the call will be Mike Massaro, CEO, Rob Orgel, President and COO, and Cosmin Pitigoi, CFO. The conference call can be accessed live via webcast from the Company’s investor relations website at https://ir.flywire.com/. A replay will be available on the investor relations website following the call.
Note Regarding Share Repurchase Program
Repurchases under the Company’s share repurchase program (the Repurchase Program) may be made from time to time through open market purchases, in privately negotiated transactions or by other means, including through the use of trading plans intended to qualify under Rule 10b5-1 under the Securities Exchange Act of 1934, as amended, in accordance with applicable securities laws and other restrictions, including
Rule 10b-18. The timing, value and number of shares repurchased will be determined by the Company in its discretion and will be based on various factors, including an evaluation of current and future capital needs, current and forecasted cash flows, the Company’s capital structure, cost of capital and prevailing stock prices, general market and economic conditions, applicable legal requirements, and compliance with covenants in the Company’s credit facility that may limit share repurchases based on defined leverage ratios. The Repurchase Program does not obligate the Company to purchase a specific number of, or any, shares. The Repurchase Program does not expire and may be modified, suspended, or terminated at any time without notice at the Company’s discretion.
Key Operating Metrics and Non-GAAP Financial Measures
Flywire uses non-GAAP financial measures to supplement financial information presented on a GAAP basis. The Company believes that excluding certain items from its GAAP results allows management to better understand its consolidated financial performance from period to period and better project its future consolidated financial performance as forecasts are developed at a level of detail different from that used to prepare GAAP-based financial measures. Moreover, Flywire believes these non-GAAP financial measures provide its stakeholders with useful information to help them evaluate the Company’s operating results by facilitating an enhanced understanding of the Company’s operating performance and enabling them to make more meaningful period-to-period comparisons. There are limitations to the use of the non-GAAP financial measures presented here. Flywire’s non-GAAP financial measures may not be comparable to similarly titled measures of other companies. Other companies, including companies in Flywire’s industry, may calculate non-GAAP financial measures differently, limiting the usefulness of those measures for comparative purposes.
Flywire uses supplemental measures of its performance, which are derived from its consolidated financial information, but which are not presented in its consolidated financial statements prepared in accordance with GAAP. These non-GAAP financial measures include the following:
| • | Revenue Less Ancillary Services. Revenue Less Ancillary Services represents the Company’s consolidated revenue in accordance with GAAP less (i) pass-through cost for printing and mailing services and (ii) marketing fees. The Company excludes these amounts to arrive at this supplemental non-GAAP financial measure as it views these services as ancillary to the primary services it provides to its clients. |
| • | Adjusted Gross Profit and Adjusted Gross Margin. Adjusted gross profit represents Revenue Less Ancillary Services less cost of revenue adjusted to (i) exclude pass-through cost for printing services, (ii) offset marketing fees against costs incurred and (iii) exclude depreciation and amortization, including accelerated amortization on the impairment of customer set-up costs tied to technology integration, if applicable. Adjusted Gross Margin represents Adjusted Gross Profit divided by Revenue Less Ancillary Services. Management believes this presentation supplements the GAAP presentation of Gross Profit and Gross Margin with a useful measure of the gross profit and gross margin of the Company’s payment-related services, which are the primary services it provides to its clients. |
| • | Adjusted EBITDA. EBITDA represents our consolidated net income (loss) in accordance with GAAP adjusted to include (i) interest expense, (ii) interest income, (iii) (benefit from) provision for income taxes and (iv) depreciation and amortization. Adjusted EBITDA represents EBITDA further adjusted by excluding (a) stock-based compensation expense and related payroll taxes, (b) the impact from the change in fair value measurement for contingent consideration associated with acquisitions,(c) gain (loss) from the remeasurement of foreign currency, (d) indirect taxes related to intercompany activity, (e) acquisition related transaction costs, (f) employee retention costs, such as incentive compensation, associated with acquisition activities and (g) restructuring costs. Management believes that the exclusion of these amounts to calculate Adjusted EBITDA provides useful measures for period-to-period comparisons of the Company’s business. |
| • | Adjusted EBITDA Margin—Adjusted EBITDA Margin represents Adjusted EBITDA divided by Revenue Less Ancillary Services. Management believes this presentation supplements the GAAP presentation of gross margin with a useful measure of the gross margin of the Company’s payment-related services, which are the primary services it provides to its clients. |
| • | FX Neutral Revenue Less Ancillary Services. FX Neutral Revenue Less Ancillary Services represents Revenue Less Ancillary Services adjusted to show presentation on a FX Neutral basis. The FX Neutral information presented is calculated by translating current-period results using prior-period weighted average foreign currency exchange rates. Flywire analyzes Revenue Less Ancillary Services on an FX Neutral basis to provide a comparable framework for assessing how the business performed, excluding the effect of foreign currency fluctuations. |
| • | Non-GAAP Operating Expenses—Non-GAAP Operating Expenses represents GAAP Operating Expenses adjusted by excluding (i) stock-based compensation expense and related payroll taxes, (ii) depreciation and amortization, (iii) acquisition related transaction costs, if applicable, (iv) employee retention costs, such as incentive compensation, associated with acquisition activities, (v) the impact from the change in fair value measurement for contingent consideration associated with acquisitions and (vi) restructuring costs. |
| • | FX Neutral Revenue Less Ancillary Services and Adjusted EBITDA, excluding Sertifi - FX Neutral Revenue Less Ancillary Services and Adjusted EBITDA, excluding Sertifi, represents FX Neutral Revenue Less Ancillary Services and Adjusted EBITDA, respectively, adjusted by excluding the contributions from Sertifi. Flywire believes these measures are useful in understanding the ongoing results of our operations. |
These non-GAAP financial measures are not meant to be considered as indicators of performance in isolation from or as a substitute for the Company’s revenue, gross profit, gross margin or net income (loss), or operating expenses prepared in accordance with GAAP and should be read only in conjunction with financial information presented on a GAAP basis. Reconciliations of these non-GAAP financial measures to the most directly comparable GAAP financial measure are presented below. Flywire encourages you to review these reconciliations in conjunction with the presentation of the non-GAAP financial measures for each of the periods presented. In future fiscal periods, Flywire may exclude such items and may incur income and expenses similar to these excluded items.
Flywire has not provided a quantitative reconciliation of forecasted FX-Neutral Revenue Less Ancillary Services Growth to forecasted GAAP Revenue Growth or forecasted Adjusted EBITDA Margin Growth to forecasted GAAP Net Income Margin Growth or to forecasted GAAP net income (loss) before income taxes within this earnings release because it is unable, without making unreasonable efforts, to calculate certain reconciling items with confidence. These items include, but are not limited to, income taxes, which are directly impacted by unpredictable fluctuations in the market price of Flywire’s stock and foreign currency exchange rates. For figures in this press release reported on an “FX-Neutral basis,” Flywire calculates the year-over-year impact of foreign currency movements using prior period weighted average foreign currency exchange rates.
About Flywire
Flywire is a global payments enablement and software company. We combine our proprietary global payments network, next-gen payments platform and vertical-specific software to deliver the most important and complex payments for our clients and their customers.
Flywire leverages its vertical-specific software and payments technology to deeply embed within the existing A/R workflows for its clients across the education, healthcare, and travel vertical markets, as well as in key B2B industries. Flywire also integrates with leading ERP systems, such as NetSuite, so organizations can optimize the payment experience for their customers while eliminating operational challenges.
Flywire supports over 4,600** clients with diverse payment methods in more than 140 currencies across 250 countries and territories around the world. Flywire is headquartered in Boston, MA, USA, with global offices. For more information, visit www.flywire.com. Follow Flywire on X (formerly known as Twitter), LinkedIn and Facebook.
| ** | Excludes clients from Flywire’s Invoiced and Sertifi acquisitions |
Safe Harbor Statement
This release contains forward-looking statements within the meaning of the Private Securities Litigation Reform Act of 1995, including, but not limited to, statements regarding Flywire’s future operating results and financial position, Flywire’s business strategy and plans, market growth, and Flywire’s objectives for future operations. Flywire intends such forward-looking statements to be covered by the safe harbor provisions for forward-looking statements contained in Section 21E of the Securities Exchange Act of 1934 and the Private Securities Litigation Reform Act of 1995. In some cases, you can identify forward-looking statements by terms such as, but not limited to, “believe,” “may,” “will,” “potentially,” “estimate,” “continue,” “anticipate,” “intend,” “could,” “would,” “project,” “target,” “plan,” “expect,” or the negative of these terms, and similar expressions intended to identify forward-looking statements. Such forward-looking statements are based upon current expectations that involve risks, changes in circumstances, assumptions, and uncertainties. Important factors that could cause actual results to differ materially from those reflected in Flywire’s forward-looking statements include, among others, Flywire’s future financial performance, including its expectations regarding FX Neutral Revenue Less Ancillary Services growth, and Adjusted EBITDA margin growth and foreign exchange rates. Risks that may cause actual results to differ materially from these forward looking statements include, but are not limited to: Flywire’s ability to execute its business plan and effectively manage its growth; Flywire’s cross-border expansion plans and ability to expand internationally; anticipated trends, growth rates, and challenges in Flywire’s business and in the markets in which Flywire operates; the sufficiency of Flywire’s cash and cash equivalents to meet its liquidity needs; political, economic, foreign currency exchange rate, inflation, legal, social and health risks, that may affect Flywire’s business or the global economy; Flywire’s beliefs and objectives for future operations; Flywire’s ability to develop and protect its brand; Flywire’s ability to maintain and grow the payment volume that it processes; Flywire’s ability to further attract, retain, and expand its client base; Flywire’s ability to develop new solutions and services and bring them to market in a timely manner; Flywire’s expectations concerning relationships with third parties, including financial institutions and strategic partners; the effects of increased competition in Flywire’s markets and its ability to compete effectively; recent and future acquisitions or investments in complementary companies, products, services, or
technologies; Flywire’s ability to enter new client verticals, including its relatively new business-to-business sector; Flywire’s expectations regarding anticipated technology needs and developments and its ability to address those needs and developments with its solutions; Flywire’s expectations regarding its ability to meet existing performance obligations and maintain the operability of its solutions; Flywire’s expectations regarding the effects of existing and developing laws and regulations, including with respect to payments and financial services, taxation, privacy and data protection; Flywire’s ability to adapt its business to changes in government policy regarding tariffs and immigration; economic and industry trends, including the risk of a global recession, projected growth, or trend analysis; the effects of global events and geopolitical conflicts, including without limitation the continuing hostilities in Ukraine and involving Israel; Flywire’s ability to adapt to changes in U.S. federal income or other tax laws or the interpretation of tax laws, including the Inflation Reduction Act of 2022; Flywire’s ability to attract and retain qualified employees; Flywire’s ability to maintain, protect, and enhance its intellectual property; Flywire’s ability to maintain the security and availability of its solutions; the increased expenses associated with being a public company; the future market price of Flywire’s common stock; and other factors that are described in the “Risk Factors” and “Management’s Discussion and Analysis of Financial Condition and Results of Operations” sections of Flywire’s Annual Report on Form 10-K for the year ended December 31, 2024 which is on file with the Securities and Exchange Commission (SEC) and available on the SEC’s website at https://www.sec.gov/. Additional factors may be described in those sections of Flywire’s Quarterly Report on Form 10-Q for the quarter ended March 31, 2025, expected to be filed in the second quarter of 2025. The information in this release is provided only as of the date of this release, and Flywire undertakes no obligation to update any forward-looking statements contained in this release on account of new information, future events, or otherwise, except as required by law.
Contacts
Investor Relations:
Masha Kahn
ir@Flywire.com
Media:
Sarah King
Media@Flywire.com
Condensed Consolidated Statements of Operations and Comprehensive Loss
(Unaudited) (Amounts in thousands, except share and per share amounts)
| Three Months Ended March 31, | ||||||||
| 2025 | 2024 | |||||||
| Revenue |
$ | 133,452 | $ | 114,103 | ||||
| Costs and operating expenses: |
||||||||
| Payment processing services costs |
50,563 | 41,650 | ||||||
| Technology and development |
16,911 | 16,737 | ||||||
| Selling and marketing |
36,569 | 30,083 | ||||||
| General and administrative |
33,058 | 31,596 | ||||||
| Restructuring Costs |
7,339 | — | ||||||
|
|
|
|
|
|||||
| Total costs and operating expenses |
144,440 | 120,066 | ||||||
|
|
|
|
|
|||||
| Loss from operations |
$ | (10,988 | ) | $ | (5,963 | ) | ||
|
|
|
|
|
|||||
| Other income (expense): |
||||||||
| Interest expense |
(724 | ) | (142 | ) | ||||
| Interest income |
2,934 | 5,879 | ||||||
| Gain (loss) from remeasurement of foreign currency |
3,892 | (4,376 | ) | |||||
| Realized loss on available-for-sale debt securities |
(158 | ) | — | |||||
|
|
|
|
|
|||||
| Total other income, net |
5,944 | 1,361 | ||||||
|
|
|
|
|
|||||
| Loss before provision for income taxes |
(5,044 | ) | (4,602 | ) | ||||
| Provision (benefit) for income taxes |
(884 | ) | 1,615 | |||||
|
|
|
|
|
|||||
| Net Loss |
$ | (4,160 | ) | $ | (6,217 | ) | ||
| Foreign currency translation adjustment |
2,548 | (1,361 | ) | |||||
| Unrealized losses on available-for-sale debt securities, net |
$ | (129 | ) | $ | — | |||
|
|
|
|
|
|||||
| Total other comprehensive income (loss) |
$ | 2,419 | $ | (1,361 | ) | |||
|
|
|
|
|
|||||
| Comprehensive loss |
$ | (1,741 | ) | $ | (7,578 | ) | ||
|
|
|
|
|
|||||
| Net loss attributable to common stockholders - basic and diluted |
$ | (4,160 | ) | $ | (6,217 | ) | ||
|
|
|
|
|
|||||
| Net loss per share attributable to common stockholders - basic and diluted |
$ | (0.03 | ) | $ | (0.05 | ) | ||
|
|
|
|
|
|||||
| Weighted average common shares outstanding - basic and diluted |
123,235,263 | 123,143,343 | ||||||
|
|
|
|
|
|||||
Condensed Consolidated Balance Sheets
(Unaudited) (Amounts in thousands, except share amounts)
| March 31, | December 31, | |||||||
| 2025 | 2024 | |||||||
| Assets |
||||||||
| Current assets: |
||||||||
| Cash and cash equivalents |
$ | 190,507 | $ | 495,242 | ||||
| Restricted cash |
— | — | ||||||
| Short-term investments |
64,823 | 115,848 | ||||||
| Accounts receivable, net |
33,585 | 23,703 | ||||||
| Unbilled receivables, net |
11,431 | 15,453 | ||||||
| Funds receivable from payment partners |
64,237 | 90,110 | ||||||
| Prepaid expenses and other current assets |
31,947 | 22,528 | ||||||
|
|
|
|
|
|||||
| Total current assets |
396,530 | 762,884 | ||||||
| Long-term investments |
18,069 | 50,125 | ||||||
| Property and equipment, net |
17,391 | 17,160 | ||||||
| Intangible assets, net |
202,014 | 118,684 | ||||||
| Goodwill |
402,715 | 149,558 | ||||||
| Other assets |
23,629 | 24,035 | ||||||
|
|
|
|
|
|||||
| Total assets |
$ | 1,060,348 | $ | 1,122,446 | ||||
|
|
|
|
|
|||||
| Liabilities and Stockholders’ Equity |
||||||||
| Current liabilities: |
||||||||
| Accounts payable |
$ | 15,069 | $ | 15,353 | ||||
| Funds payable to clients |
106,613 | 217,788 | ||||||
| Accrued expenses and other current liabilities |
53,022 | 49,297 | ||||||
| Deferred revenue |
21,228 | 7,337 | ||||||
|
|
|
|
|
|||||
| Total current liabilities |
195,932 | 289,775 | ||||||
| Long-term debt |
60,000 | — | ||||||
| Deferred tax liabilities |
13,216 | 12,643 | ||||||
| Other liabilities |
6,935 | 5,261 | ||||||
|
|
|
|
|
|||||
| Total liabilities |
276,083 | 307,679 | ||||||
|
|
|
|
|
|||||
| Commitments and contingencies (Note 16) Stockholders’ equity: |
||||||||
| Preferred stock, $0.0001 par value; 10,000,000 shares authorized as of December 31, 2024 and 2023; and no shares issued and outstanding as of December 31, 2024 and 2023 |
— | — | ||||||
| Voting common stock, $0.0001 par value; 2,000,000,000 shares authorized as of March 31, 2025 and December 31, 2024; 128,419,082 shares issued and 120,204,647 shares outstanding as of March 31, 2025; 126,853,852 shares issued and 122,182,878 shares outstanding as of December 31, 2024 |
13 | 13 | ||||||
| Non-voting common stock, $0.0001 par value; 10,000,000 shares authorized as of March 31, 2025 and December 31, 2024; 1,873,320 shares issued and outstanding as of March 31, 2025 and December 31, 2024 |
— | — | ||||||
| Treasury voting conmon stock, 8,214,435 and 4,670,974 shares as of March 31, 2025 and December 31, 2024 respectively, held at cost |
(94,489 | ) | (46,268 | ) | ||||
| Additional paid-in capital |
1,053,289 | 1,033,958 | ||||||
| Accumulated other comprehensive income |
482 | (2,066 | ) | |||||
| Accumulated deficit |
(175,030 | ) | (170,870 | ) | ||||
|
|
|
|
|
|||||
| Total stockholders’ equity |
784,265 | 814,767 | ||||||
|
|
|
|
|
|||||
| Total liabilities and stockholders’ equity |
$ | 1,060,348 | $ | 1,122,446 | ||||
|
|
|
|
|
|||||
Condensed Consolidated Statement of Cash Flows
(Unaudited) (Amounts in thousands)
| Three Months Ended March 31, | ||||||||
| 2025 | 2024 | |||||||
| Cash flows from operating activities: |
||||||||
| Net loss |
$ | (4,160 | ) | $ | (6,217 | ) | ||
| Adjustments to reconcile net loss to net cash used in operating activities: |
||||||||
| Depreciation and amortization |
5,502 | 4,259 | ||||||
| Stock-based compensation expense |
18,218 | 14,842 | ||||||
| Amortization of deferred contract costs |
376 | 242 | ||||||
| Change in fair value of contingent consideration |
165 | (478 | ) | |||||
| Deferred tax provision (benefit) |
1,174 | (643 | ) | |||||
| Provision for uncollectible accounts |
28 | (16 | ) | |||||
| Non-cash interest expense |
46 | 92 | ||||||
| Non-cash interest income |
(508 | ) | — | |||||
| Changes in operating assets and liabilities, net of acquisitions: |
||||||||
| Accounts receivable |
(3,492 | ) | (1,457 | ) | ||||
| Unbilled receivables |
4,068 | 2,694 | ||||||
| Funds receivable from payment partners |
25,873 | 37,714 | ||||||
| Prepaid expenses, other current assets and other assets |
(9,151 | ) | 1,863 | |||||
| Funds payable to clients |
(111,175 | ) | (86,810 | ) | ||||
| Accounts payable, accrued expenses and other current liabilities |
(5,130 | ) | (2,489 | ) | ||||
| Contingent consideration |
— | — | ||||||
| Other liabilities |
(255 | ) | (340 | ) | ||||
| Deferred revenue |
(469 | ) | (1,349 | ) | ||||
|
|
|
|
|
|||||
| Net cash used in operating activities |
(78,890 | ) | (38,093 | ) | ||||
|
|
|
|
|
|||||
| Cash flows from investing activities: |
||||||||
| Acquisition of businesses, net of cash acquired |
(319,835 | ) | — | |||||
| Purchase of debt securities |
(15,252 | ) | — | |||||
| Sale of debt securities |
98,712 | — | ||||||
| Capitalization of internally developed software |
(1,310 | ) | (1,259 | ) | ||||
| Purchases of property and equipment |
(187 | ) | (255 | ) | ||||
|
|
|
|
|
|||||
| Net cash used in investing activities |
(237,872 | ) | (1,514 | ) | ||||
|
|
|
|
|
|||||
| Cash flows from financing activities: |
||||||||
| Proceeds from draw on line of credit |
125,000 | — | ||||||
| Payment of line of credit debt |
(65,000 | ) | ||||||
| Payment of debt issuance costs |
— | (783 | ) | |||||
| Payments of tax withholdings for net settled equity awards |
(1,676 | ) | — | |||||
| Purchases of treasury stock |
(49,304 | ) | — | |||||
| Proceeds from the issuance of stock under Employee Stock Purchase Plan |
1,242 | 1,415 | ||||||
| Proceeds from exercise of stock options |
1,377 | 1,617 | ||||||
|
|
|
|
|
|||||
| Net cash provided by financing activities |
11,639 | 2,249 | ||||||
|
|
|
|
|
|||||
| Effect of exchange rates changes on cash and cash equivalents |
388 | 1,764 | ||||||
|
|
|
|
|
|||||
| Net decrease in cash, cash equivalents and restricted |
(304,735 | ) | (35,594 | ) | ||||
| Cash, cash equivalents and restricted cash, beginning of year |
$ | 495,242 | $ | 654,608 | ||||
|
|
|
|
|
|||||
| Cash, cash equivalents and restricted cash, end of year |
$ | 190,507 | $ | 619,014 | ||||
|
|
|
|
|
|||||
Reconciliation of Non-GAAP Financial Measures
(Unaudited) (Amounts in millions, except percentages)
| Three Months Ended March 31, |
||||||||
| 2025 | 2024 | |||||||
| Revenue |
$ | 133.5 | $ | 114.1 | ||||
| Adjusted to exclude gross up for: |
||||||||
| Pass-through cost for printing and mailing |
(4.4 | ) | (3.6 | ) | ||||
| Marketing fees |
(0.3 | ) | (0.3 | ) | ||||
|
|
|
|
|
|||||
| Revenue Less Ancillary Services |
$ | 128.7 | $ | 110.2 | ||||
|
|
|
|
|
|||||
| Payment processing services costs |
50.6 | 41.7 | ||||||
| Hosting and amortization costs within technology and development |
2.4 | 2.0 | ||||||
|
|
|
|
|
|||||
| Cost of Revenue |
$ | 53.0 | $ | 43.7 | ||||
|
|
|
|
|
|||||
| Adjusted to: |
||||||||
| Exclude printing and mailing costs |
(4.4 | ) | (3.6 | ) | ||||
| Offset marketing fees against related costs |
(0.3 | ) | (0.3 | ) | ||||
| Exclude depreciation and amortization |
(2.0 | ) | (1.5 | ) | ||||
|
|
|
|
|
|||||
| Adjusted Cost of Revenue |
$ | 46.2 | $ | 38.3 | ||||
| Gross Profit |
$ | 80.5 | $ | 70.4 | ||||
| Gross Margin |
60.3 | % | 61.7 | % | ||||
|
|
|
|
|
|||||
| Adjusted Gross Profit |
$ | 82.5 | $ | 71.9 | ||||
| Adjusted Gross Margin |
64.1 | % | 65.2 | % | ||||
|
|
|
|
|
|||||
FX Neutral Revenue less Ancillary Services
(unaudited) (in millions)
| Three Months Ended March 31, |
||||||||
| 2025 | 2024 | |||||||
| Revenue |
$ | 133.5 | $ | 114.1 | ||||
| Ancillary services |
(4.8 | ) | (3.9 | ) | ||||
|
|
|
|
|
|||||
| Revenue Less Ancillary Services |
128.7 | 110.2 | ||||||
|
|
|
|
|
|||||
| Effects of foreign currency rate fluctuations |
2.0 | — | ||||||
|
|
|
|||||||
| FX Neutral Revenue Less Ancillary Services |
$ | 130.7 | $ | 110.2 | ||||
|
|
|
|
|
|||||
| Revenue Less Ancillary Services |
$ | 128.7 | $ | 110.2 | ||||
| Sertifi Revenue |
(4.7 | ) | — | |||||
|
|
|
|
|
|||||
| Revenue Less Ancillary Services excluding Sertifi |
$ | 124.0 | $ | 110.2 | ||||
|
|
|
|
|
|||||
Reconciliation of Non-GAAP Operating Expenses
(Unaudited) (in millions)
| Three Months Ended March 31, |
||||||||
| 2025 | 2024 | |||||||
| GAAP Technology and development |
$ | 16.9 | $ | 16.7 | ||||
| (-) Stock-based compensation expense and related taxes |
(3.2 | ) | (2.6 | ) | ||||
| (-) Depreciation and amortization |
(1.6 | ) | (1.9 | ) | ||||
|
|
|
|
|
|||||
| Non-GAAP Technology and development |
$ | 12.1 | $ | 12.2 | ||||
|
|
|
|
|
|||||
| GAAP Selling and marketing |
$ | 36.6 | $ | 30.1 | ||||
| (-) Stock-based compensation expense and related taxes |
(4.3 | ) | (4.1 | ) | ||||
| (-) Depreciation and amortization |
(3.0 | ) | (1.9 | ) | ||||
|
|
|
|
|
|||||
| Non-GAAP Selling and marketing |
$ | 29.3 | $ | 24.1 | ||||
|
|
|
|
|
|||||
| GAAP General and administrative |
$ | 33.1 | $ | 31.6 | ||||
| (-) Stock-based compensation expense and related taxes |
(8.4 | ) | (8.4 | ) | ||||
| (-) Depreciation and amortization |
(0.8 | ) | (0.7 | ) | ||||
| (-) Change in fair value of contingent consideration |
(0.2 | ) | 0.5 | |||||
| (-) Acquisition related transaction costs |
(2.5 | ) | — | |||||
|
|
|
|
|
|||||
| Non-GAAP General and administrative |
$ | 21.2 | $ | 23.0 | ||||
|
|
|
|
|
|||||
EBITDA, Adjusted EBITDA and Adjusted EBITDA excluding Sertifi
(Unaudited) (in millions)
| Three Months Ended March 31, |
||||||||
| 2025 | 2024 | |||||||
| Net loss |
$ | (4.2 | ) | $ | (6.2 | ) | ||
| Interest expense |
0.7 | 0.1 | ||||||
| Interest income |
(2.9 | ) | (5.9 | ) | ||||
| Provision for income taxes |
(0.9 | ) | 1.6 | |||||
| Depreciation and amortization |
5.9 | 4.5 | ||||||
|
|
|
|
|
|||||
| EBITDA |
(1.4 | ) | (5.9 | ) | ||||
| Stock-based compensation expense and related taxes |
15.9 | 15.1 | ||||||
| Change in fair value of contingent consideration |
0.2 | (0.5 | ) | |||||
| (Gain) Loss from remeasurement of foreign currency |
(3.6 | ) | 4.4 | |||||
| Indirect taxes related to intercompany activity |
0.6 | 0.1 | ||||||
| Acquisition related transaction costs |
2.5 | — | ||||||
| Acquisition related employee retention costs |
— | 0.0 | ||||||
| Restructuring costs |
$ | 7.3 | $ | — | ||||
|
|
|
|
|
|||||
| Adjusted EBITDA |
$ | 21.6 | $ | 13.2 | ||||
|
|
|
|
|
|||||
| Sertifi Adjusted EBITDA Contribution |
(1.0 | ) | — | |||||
|
|
|
|
|
|||||
| Adjusted EBITDA excluding Sertifi |
$ | 20.6 | $ | 13.2 | ||||
|
|
|
|
|
|||||
Net Margin, EBITDA Margin, Adjusted EBITDA Margin and Adjusted
EBITDA Margin excluding Sertifi
(Unaudited) (Amounts in millions, except percentages)
| Three Months Ended March 31, |
||||||||
| 2025 | 2024 | |||||||
| Revenue (A) |
$ | 133.5 | $ | 114.1 | ||||
| Revenue less ancillary services (B) |
$ | 128.7 | $ | 110.2 | ||||
| Revenue less ancillary services excluding Sertifi (C) |
$ | 124.0 | — | |||||
| Net loss (D) |
$ | (4.2 | ) | $ | (6.2 | ) | ||
| EBITDA (E) |
$ | (1.4 | ) | $ | (5.9 | ) | ||
| Adjusted EBITDA (F) |
$ | 21.6 | $ | 13.2 | ||||
| Adjusted EBITDA excluding Sertifi (G) |
$ | 20.6 | — | |||||
| Net margin (D/A) |
-3.1 | % | -5.4 | % | ||||
| Net margin using RLAS (D/B) |
-3.2 | % | -5.6 | % | ||||
| EBITDA Margin (E/A) |
-1.0 | % | -5.2 | % | ||||
| Adjusted EBITDA Margin (F/A) |
16.2 | % | 11.6 | % | ||||
| Adjusted EBITDA Margin excluding Sertifi (G/A) |
15.4 | % | 0.0 | % | ||||
| EBITDA Margin using RLAS (E/B) |
-1.1 | % | -5.4 | % | ||||
| Adjusted EBITDA Margin using RLAS (F/B) |
16.8 | % | 12.0 | % | ||||
| Adjusted EBITDA Margin excluding Sertifi using RLAS excluding Sertifi (G/C) |
16.6 | % | — | |||||
Exhibit 99.2

Exhibit 99.2 1Q 2025 Earnings Supplement May 6, 2025
Disclosures This presentation includes forward-looking statements within the meaning of the Private Securities Litigation Reform Act of 1995 and Section 21E of the Securities Exchange Act of 1934, as amended. All statements other than statements of historical facts contained in this presentation, including statements regarding the outcome of the operational and portfolio reviews, the costs, cash outlays, benefits, timing and financial impacts of the actions that may be taken or transactions entered into in connection with the operational and portfolio reviews, expected benefits and synergies of the acquisition of Sertifi LLC, the benefits of Sertifi’s platform, financial results and margins, Flywire’s ability to successfully implement Flywire’s business plan, future results of operations and financial position, business strategy and plans and Flywire’s objectives for future operations, are forward -looking statements. The words “believe,” “may,” “will,” “estimate,” “continue,” “anticipate,” “intend,” “expect,” “plans,” “potential,” “seeks,” “projects,” “should,” “could” and “would” and similar expressions are intended to identify forward-looking statements, although not all forward-looking statements contain these identifying words. Flywire has based these forward-looking statements largely on Flywire’s current expectations and projections about future events and financial trends that Flywire believes may affect Flywire’s financial condition, results of operations, business strategy, short-term and long-term business operations and objectives, and financial needs. These forward-looking statements are subject to a number of risks, uncertainties and assumptions that are described in the “Risk Factors” and “Management’s Discussion and Analysis of Financial Condition and Results of Operations” sections of Flywire’s Annual Report on Form 10-K for the year ended December 31, 2024, which is on file with the Securities and Exchange Commission (SEC) and available on the SEC’s website at www.sec.gov. Additional factors may be described in those sections of Flywire’s Quarterly Report on Form 10-Q for the quarter ended March 31, 2025, expected to be filed with the SEC in the second quarter of 2025. In light of these risks, uncertainties and assumptions, the forward -looking events and circumstances discussed in this presentation may not occur and actual results could differ materially and adversely from those anticipated or implied in the forward-looking statements. You should not rely upon forward-looking statements as predictions of future events or performance. In addition, projections, assumptions and estimates of the future performance of the industries in which Flywire operates and the markets it serves are inherently imprecise and subject to a high degree of uncertainty and risk. All financial projections contained in this presentation are forward -looking statements and are based on Flywire’s management’s assessment of such matters. It is unlikely, however, that the assumptions on which Flywire has based its projections will prove to be fully correct or that the projected figures will be attained. Flywire’s actual future results may differ materially from Flywire’s projections, and it makes no express or implied representation or warranty as to attainability of the results reflected in these projections. Investments in Flywire’s securities involve a high degree of risk and should be regarded as speculative. Certain information contained in this presentation, including Flywire’s estimated Total Addressable Market (TAM), relates to or is based on studies, publications, surveys and other data obtained from third-party sources and Flywire’s own internal estimates and research. While Flywire believes these third-party sources to be reliable as of the date of this presentation, it has not independently verified, and makes no representation as to the adequacy, fairness, accuracy or completeness of any information obtained from third-party sources. In addition, all of the market data included in this presentation involves a number of assumptions and limitations, and there can be no guarantee as to the accuracy or reliability of such assumptions. Finally, while Flywire believes its own internal research is reliable, such research has not been verified by any independent source. The information in this presentation is provided only as of May 6, 2025, and Flywire undertakes no obligation to update any forward-looking statements contained in this presentation on account of new information, future events, or otherwise, except as required by law. This presentation contains certain non-GAAP financial measures as defined by SEC rules. Flywire has provided a reconciliation of those measures to the most directly comparable GAAP measures, which is available in the Appendix. The company has not provided a quantitative reconciliation of forecasted FX-Neutral Revenue Less Ancillary Services Growth to forecasted GAAP Revenue Growth or forecasted Adjusted EBITDA Margin Growth to forecasted GAAP Net Income Margin Growth or to forecasted GAAP net income (loss) before income taxes within this presentation because Flywire is unable, without making unreasonable efforts, to calculate certain reconciling items with confidence. These items include but are not limited to income taxes which are directly impacted by unpredictable fluctuations in the market price of the company’s stock and in foreign exchange rates.
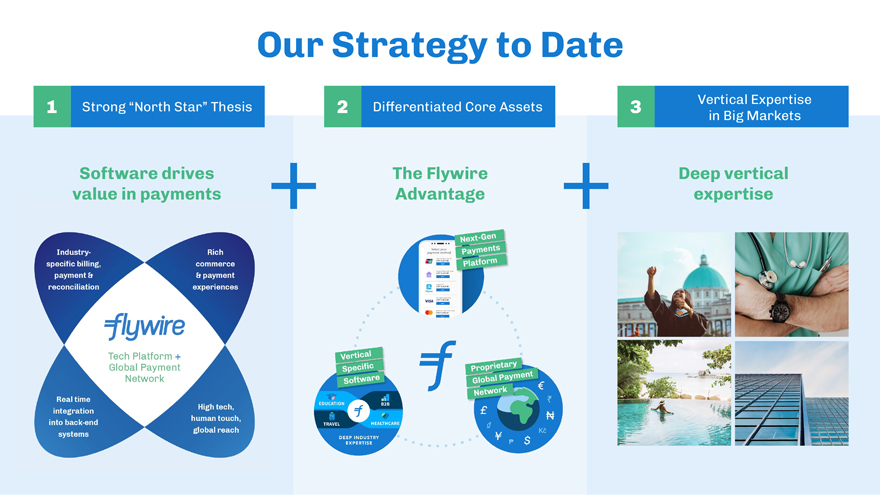
Our Strategy to Date Software drives value in payments + The Flywire Advantage 1 Strong “North Star” Thesis 2 Differentiated Core Assets Vertical Expertise 3 in Big Markets + Deep vertical expertise

Q1 2025 Performance
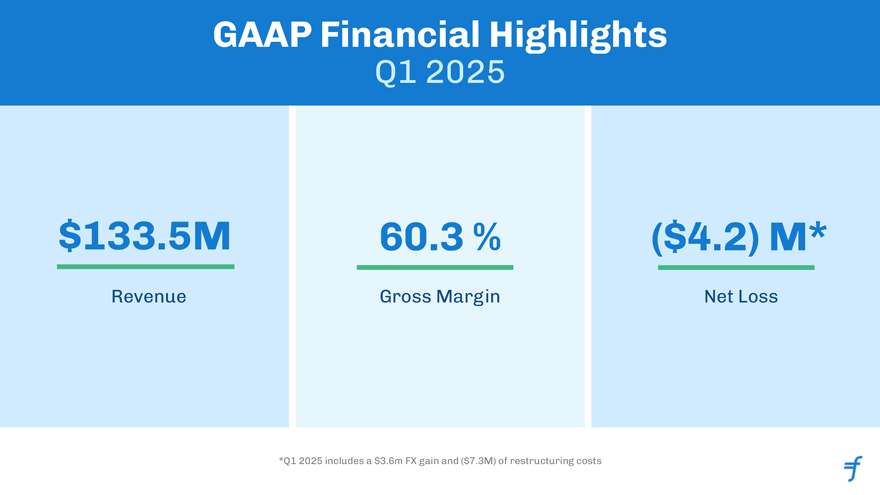
GAAP Financial Highlights Q1 2025 $133.5M Revenue 60.3 % Gross Margin ($4.2) M* Net Loss *Q1 2025 includes a $3.6m FX gain and ($7.3M) of restructuring costs
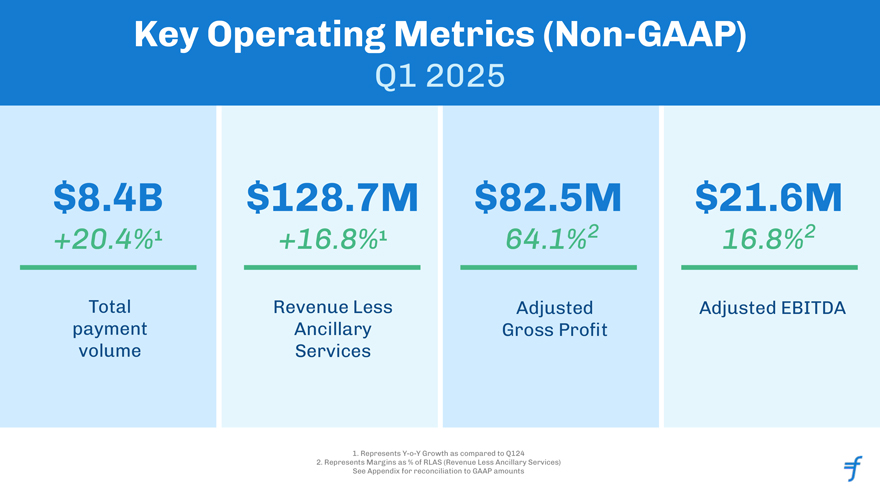
Key Operating Metrics (Non-GAAP) Q1 2025 $8.4B +20.4%1 Total payment volume $128.7M +16.8%1 Revenue Less Ancillary Services $82.5M 64.1%2 Adjusted Gross Profit $21.6M 16.8%2 Adjusted EBITDA 1. Represents Y-o-Y Growth as compared to Q124 2. Represents Margins as % of RLAS (Revenue Less Ancillary Services) See Appendix for reconciliation to GAAP amounts
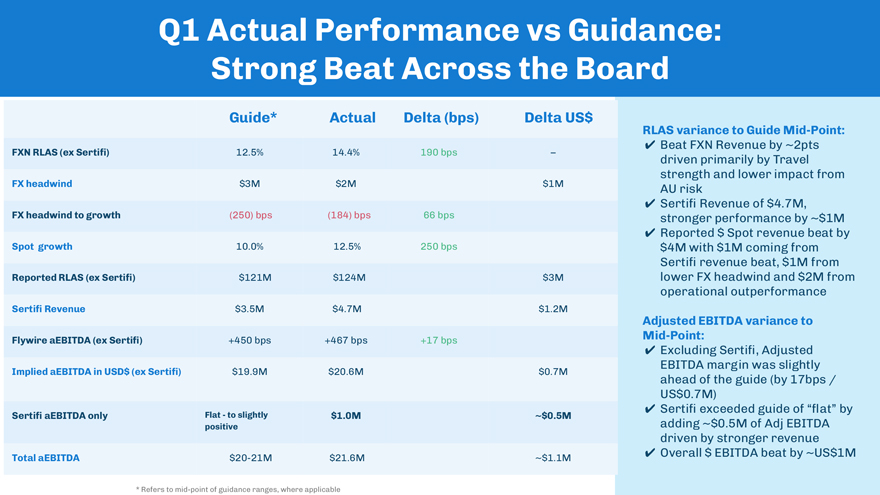
Q1 Actual Performance vs Guidance: Strong Beat Across the Board Guide* Actual Delta (bps) Delta US$ FXN RLAS (ex Sertifi) 12.5% 14.4% 190 bps – FX headwind $3M $2M $1M FX headwind to growth (250) bps (184) bps 66 bps Spot growth 10.0% 12.5% 250 bps Reported RLAS (ex Sertifi) $121M $124M $3M Sertifi Revenue $3.5M $4.7M $1.2M Flywire aEBITDA (ex Sertifi) +450 bps +467 bps +17 bps Implied aEBITDA in USD$ (ex Sertifi) $19.9M $20.6M $0.7M Sertifi aEBITDA only Flat - to slightly positive $1.0M ~$0.5M Total aEBITDA $20-21M $21.6M ~$1.1M RLAS variance to Guide Mid-Point: Beat FXN Revenue by ~2pts driven primarily by Travel strength and lower impact from AU risk Sertifi Revenue of $4.7M, stronger performance by ~$1M Reported $ Spot revenue beat by $4M with $1M coming from Sertifi revenue beat, $1M from lower FX headwind and $2M from operational outperformance Adjusted EBITDA variance to Mid-Point: Excluding Sertifi, Adjusted EBITDA margin was slightly ahead of the guide (by 17bps / US$0.7M) Sertifi exceeded guide of “flat” by adding ~$0.5M of Adj EBITDA driven by stronger revenue Overall $ EBITDA beat by ~US$1M * Refers to mid-point of guidance ranges, where applicable

Full Product Suite Strategy in Education
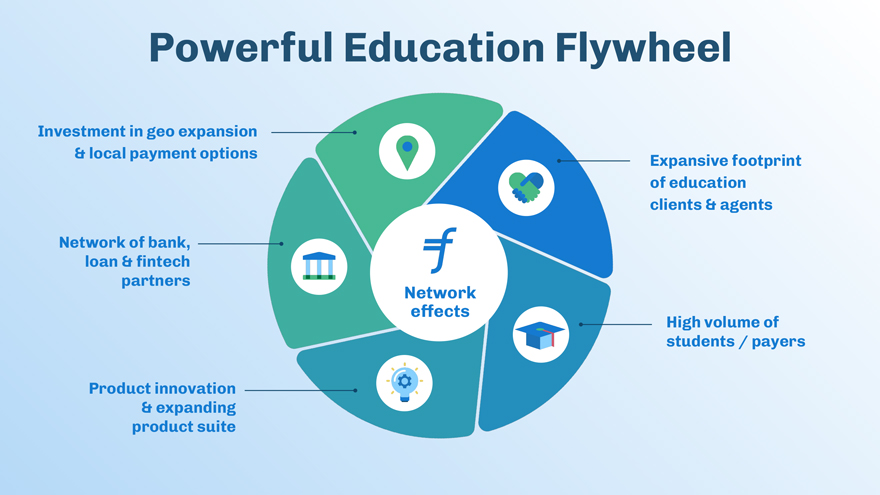
Powerful Education Flywheel Network effects Investment in geo expansion & local payment options Network of bank, loan & fintech partners Expansive footprint of education clients & agents High volume of students / payers Product innovation & expanding product suite
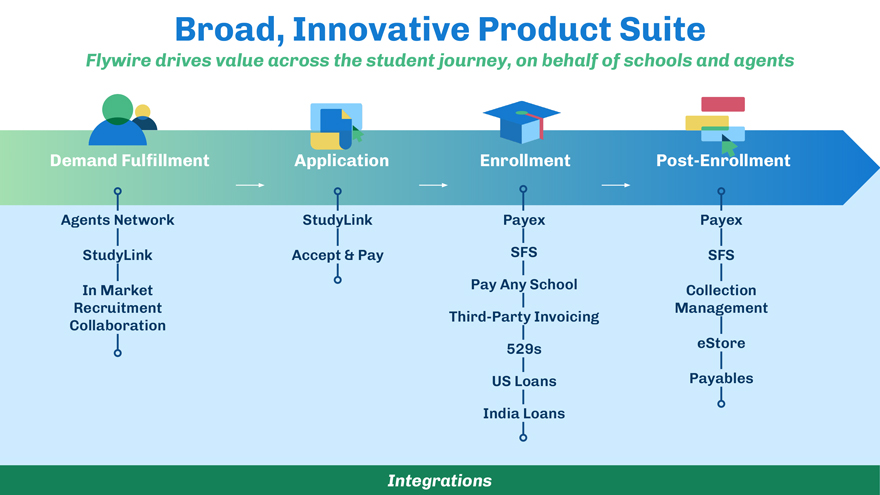
Demand Fulfillment Application Enrollment Post-Enrollment Broad, Innovative Product Suite Flywire drives value across the student journey, on behalf of schools and agents Agents Network StudyLink In Market Recruitment Collaboration StudyLink Accept & Pay Payex SFS Collection Management eStore Payables Integrations Payex SFS Pay Any School Third-Party Invoicing 529s US Loans India Loans
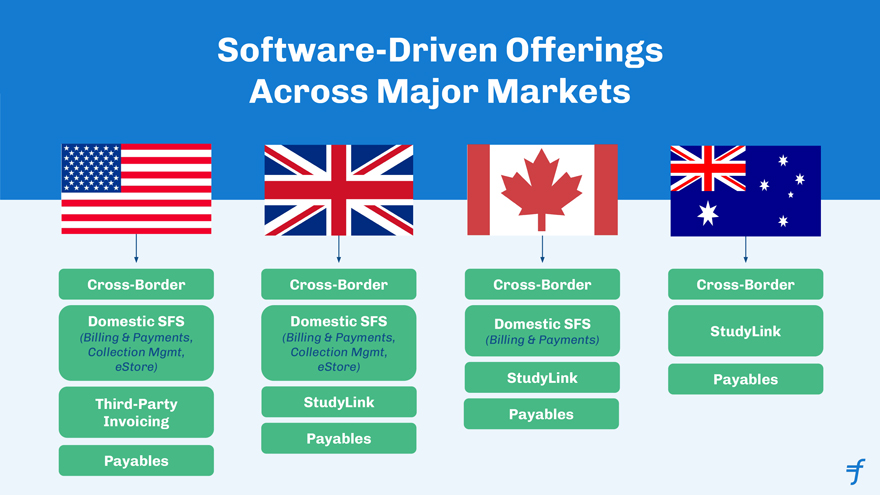
Software-Driven Offerings Across Major Markets Cross-Border Domestic SFS (Billing & Payments, Collection Mgmt, eStore) Third-Party Invoicing Cross-Border Domestic SFS (Billing & Payments, Collection Mgmt, eStore) Payables Cross-Border Domestic SFS (Billing & Payments) Cross-Border StudyLink Payables StudyLink StudyLink Payables Payables

UK SFS Exciting new product launch

Students don’t know how much they actually owe & have limited payment plan options Lack of communication options to promote self-service & drive timely payment No student portal to self-serve & limitations for families to contribute to account balance Staff overwhelmed by siloed & manual processes, reconciliation burden, and student queries Typical UK University without SFS

Mobile first experience Robust communications drive action Self-service options for staff & students Authorised user access Customise plans to meet unique needs Real-time account updates to & from finance system Student Financial Software (UK) All-in-one student account portal

Students can clearly see how much they owe & pay fees on time with flexible options One unified, integrated system with built-in communications University teams have complete visibility into cash flow with improved efficiencies Finance teams are able to automate account statements & payment plans and assist students UK University with SFS

Travel at Flywire Investing Behind Our Success
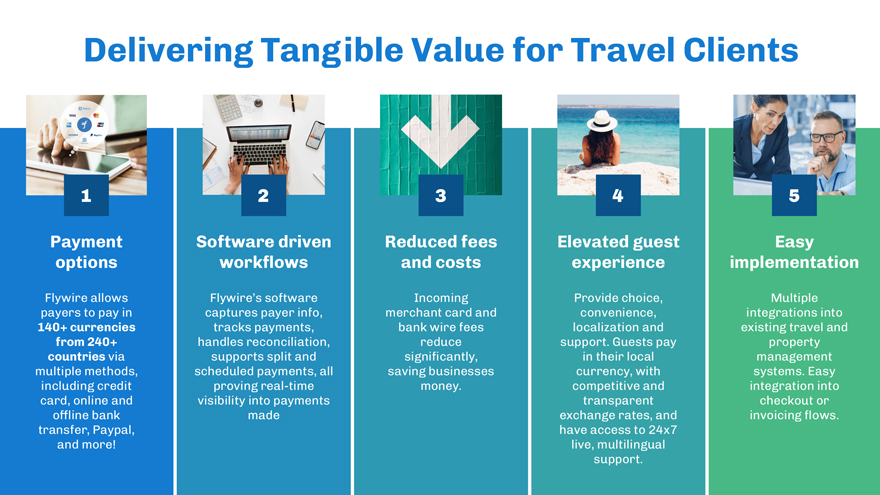
Delivering Tangible Value for Travel Clients Payment options Software driven workflows Reduced fees and costs Elevated guest experience Easy implementation Flywire allows payers to pay in 140+ currencies from 240+ countries via multiple methods, including credit card, online and offline bank transfer, Paypal, and more! Flywire’s software captures payer info, tracks payments, handles reconciliation, supports split and scheduled payments, all proving real-time visibility into payments made Provide choice, convenience, localization and support. Guests pay in their local currency, with competitive and transparent exchange rates, and have access to 24x7 live, multilingual support. Incoming merchant card and bank wire fees reduce significantly, saving businesses money. Multiple integrations into existing travel and property management systems. Easy integration into checkout or invoicing flows. 1 2 3 4 5

Building the Next Education Vertical Travel’s trajectory is similar to Education in the first 5 years EDU Travel Customer Growth Over Time Gross Profit Per Customer ($ ‘000s) Pre Sertifi Business Strong gross profit dollar growth trajectory in Travel, similar to early growth of EDU Most recently ~1200 customers and growing
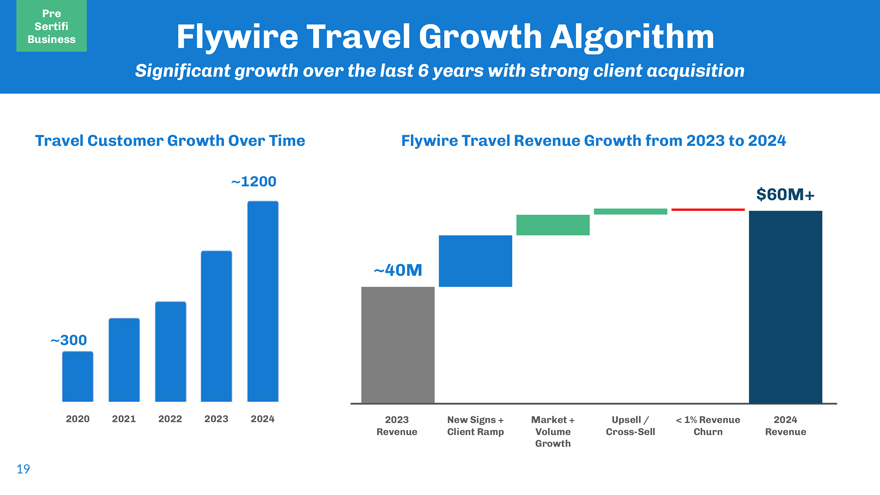
Flywire Travel Growth Algorithm Significant growth over the last 6 years with strong client acquisition 19 Travel Customer Growth Over Time Flywire Travel Revenue Growth from 2023 to 2024 2023 Revenue New Signs + Client Ramp Market + Volume Growth Upsell / Cross-Sell < 1% Revenue Churn ~40M $60M+ 2024 Revenue ` ~300 ~1200 2020 2021 2022 2023 2024 Pre Sertifi Business
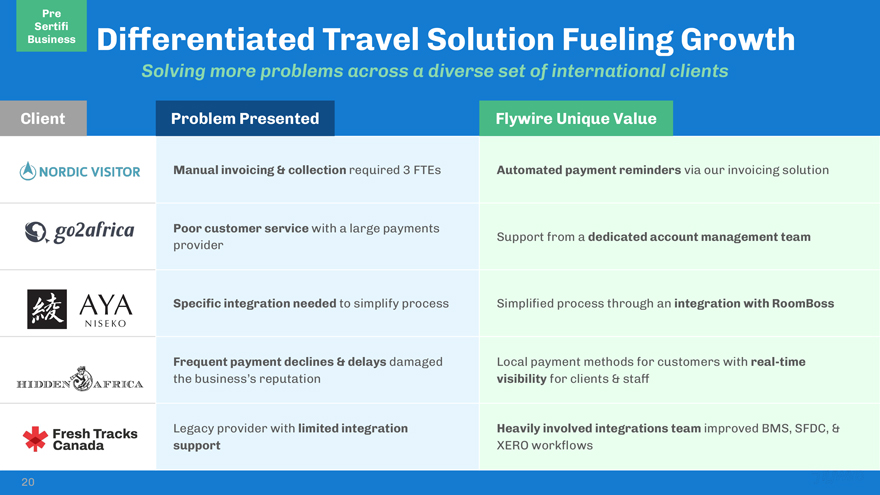
Manual invoicing & collection required 3 FTEs Automated payment reminders via our invoicing solution Poor customer service with a large payments provider Support from a dedicated account management team Specific integration needed to simplify process Simplified process through an integration with RoomBoss Frequent payment declines & delays damaged the business’s reputation Local payment methods for customers with real-time visibility for clients & staff Legacy provider with limited integration support Heavily involved integrations team improved BMS, SFDC, & XERO workflows Client Problem Presented Flywire Unique Value Differentiated Travel Solution Fueling Growth Solving more problems across a diverse set of international clients 20 Pre Sertifi Business

Hotel Description Use Case Details Collection of luxury properties across Capri, Paris, Rome & Milan Enterprise level account today (Capri) with potential to expand Size: 20-30 rooms per location FX %: High share of int’l payments Payment Use Case: capture deposit payment via payments links Luxury expedition lodges across Chile, Peru, Bolivia & Argentina Enterprise level account today Size: 20-50 rooms per location FX %: High share of int’l payments Use Case: capture deposit + balance payment via website; payment links for emails/calls … opened up the door to partnering with Sertifi Solving Problems for Luxury Hotels… Pre Sertifi Business
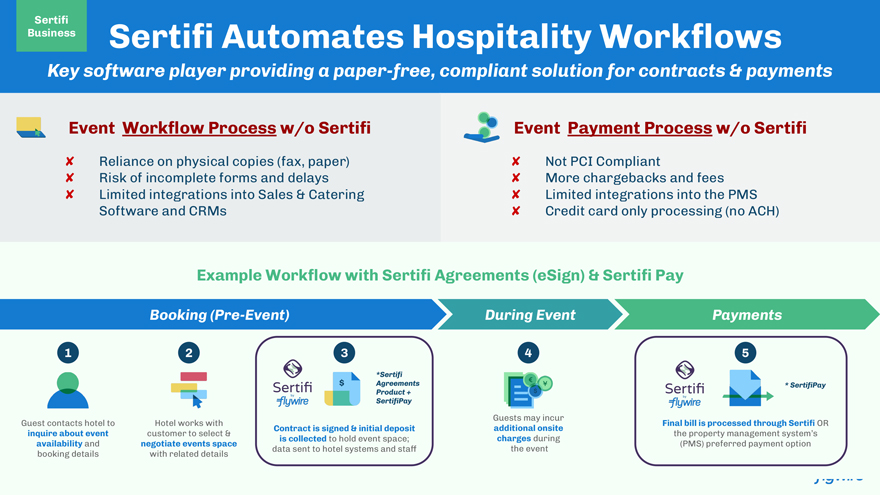
Booking (Pre-Event) During Event Payments 1 Guest contacts hotel to inquire about event availability and booking details 2 Hotel works with customer to select & negotiate events space with related details 3 Contract is signed & initial deposit is collected to hold event space; data sent to hotel systems and staff $ *Sertifi Agreements Product + SertifiPay 4 Guests may incur additional onsite charges during the event 5 * SertifiPay Example Workflow with Sertifi Agreements (eSign) & Sertifi Pay Final bill is processed through Sertifi OR the property management system’s (PMS) preferred payment option Key software player providing a paper-free, compliant solution for contracts & payments Event Workflow Process w/o Sertifi Reliance on physical copies (fax, paper) Risk of incomplete forms and delays Limited integrations into Sales & Catering Software and CRMs Not PCI Compliant More chargebacks and fees Limited integrations into the PMS Credit card only processing (no ACH) Sertifi Automates Hospitality Workflows Sertifi Business Event Payment Process w/o Sertifi
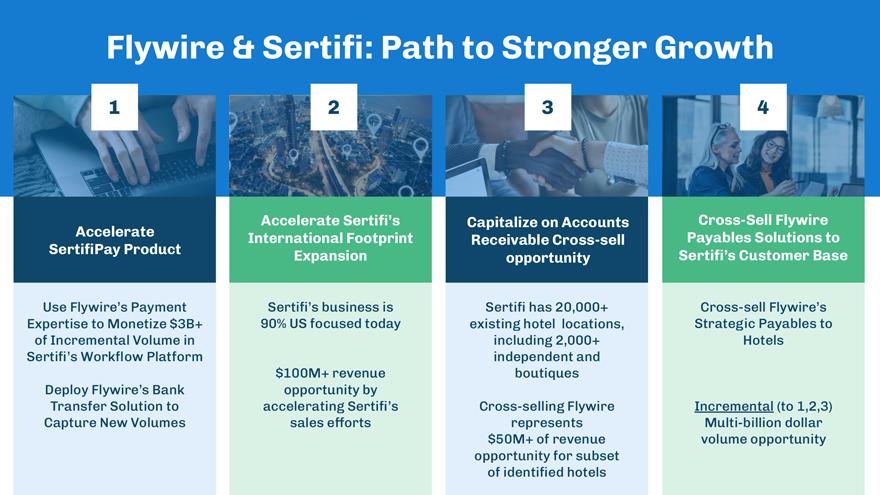
Flywire & Sertifi: Path to Stronger Growth 1 2 3 4 Sertifi has 20,000+ existing hotel locations, including 2,000+ independent and boutiques Cross-selling Flywire represents $50M+ of revenue opportunity for subset of identified hotels Sertifi’s business is 90% US focused today $100M+ revenue opportunity by accelerating Sertifi’s sales efforts Cross-sell Flywire’s Strategic Payables to Hotels Incremental (to 1,2,3) Multi-billion dollar volume opportunity Use Flywire’s Payment Expertise to Monetize $3B+ of Incremental Volume in Sertifi’s Workflow Platform Deploy Flywire’s Bank Transfer Solution to Capture New Volumes Capitalize on Accounts Receivable Cross-sell opportunity Accelerate Sertifi’s International Footprint Expansion Cross-Sell Flywire Payables Solutions to Sertifi’s Customer Base Accelerate SertifiPay Product
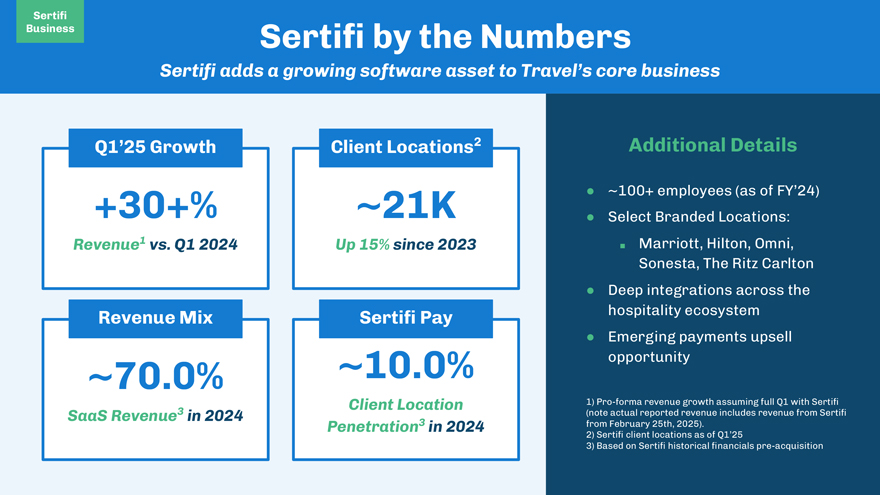
Sertifi by the Numbers Sertifi adds a growing software asset to Travel’s core business +30+% Revenue1 vs. Q1 2024 ~70.0% SaaS Revenue3 in 2024 ~10.0% Client Location Penetration3 in 2024 ~21K Up 15% since 2023 Q1’25 Growth Client Locations2 Revenue Mix Sertifi Pay 1) Pro-forma revenue growth assuming full Q1 with Sertifi (note actual reported revenue includes revenue from Sertifi from February 25th, 2025). 2) Sertifi client locations as of Q1’25 3) Based on Sertifi historical financials pre-acquisition Sertifi Business Additional Details ~100+ employees (as of FY’24) Select Branded Locations: Marriott, Hilton, Omni, Sonesta, The Ritz Carlton Deep integrations across the hospitality ecosystem Emerging payments upsell opportunity
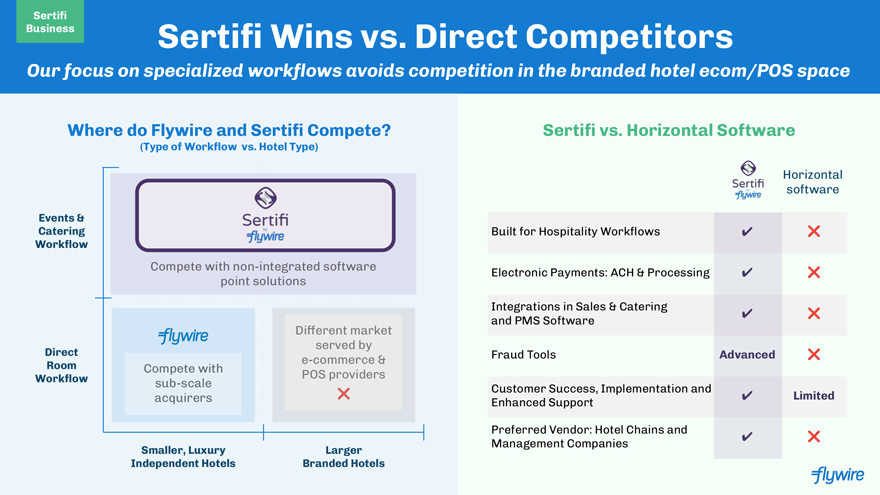
Sertifi Wins vs. Direct Competitors Our focus on specialized workflows avoids competition in the branded hotel ecom/POS space Where do Flywire and Sertifi Compete? (Type of Workflow vs. Hotel Type) Events & Catering Workflow Smaller, Luxury Independent Hotels Direct Room Workflow Larger Branded Hotels Sertifi vs. Horizontal Software Built for Hospitality Workflows Electronic Payments: ACH & Processing Integrations in Sales & Catering and PMS Software Fraud Tools Advanced Customer Success, Implementation and Enhanced Support Limited Preferred Vendor: Hotel Chains and Management Companies Compete with non-integrated software point solutions Different market served by e-commerce & POS providers Compete with sub-scale acquirers Horizontal software Sertifi Business
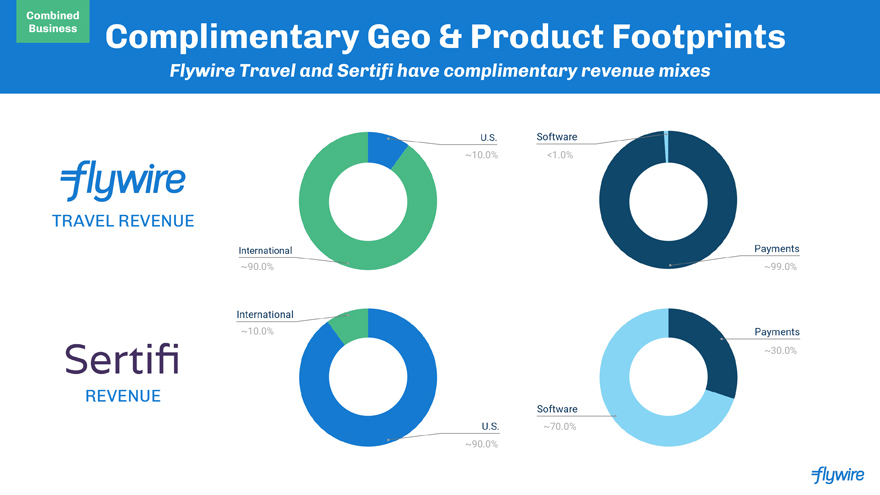
Complimentary Geo & Product Footprints Flywire Travel and Sertifi have complimentary revenue mixes TRAVEL REVENUE REVENUE ~90.0% ~10.0% ~90.0% ~10.0% <1.0% ~99.0% ~70.0% ~30.0% Combined Business
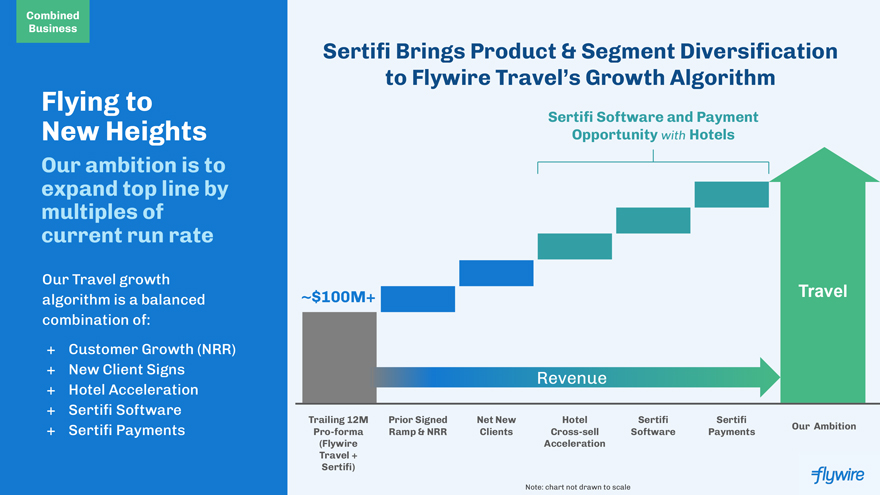
~$100M+ Trailing 12M Pro-forma (Flywire Travel + Sertifi) Travel Sertifi Software and Payment Opportunity with Hotels Our Ambition Flying to New Heights Our ambition is to expand top line by multiples of current run rate Our Travel growth algorithm is a balanced combination of: + Customer Growth (NRR) + New Client Signs + Hotel Acceleration + Sertifi Software + Sertifi Payments Sertifi Brings Product & Segment Diversification to Flywire Travel’s Growth Algorithm Prior Signed Ramp & NRR Net New Clients Hotel Cross-sell Acceleration Sertifi Software Sertifi Payments Note: chart not drawn to scale Revenue Combined Business

2025 & Q2 Financial Outlook
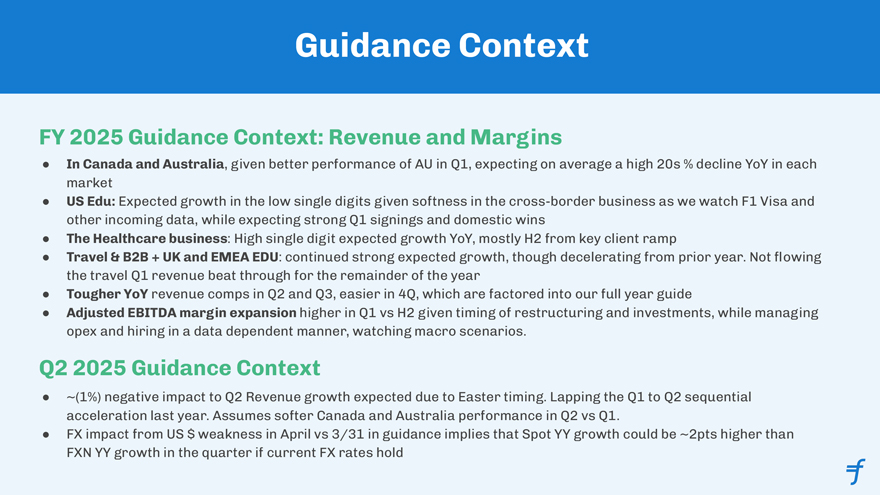
Guidance Context In Canada and Australia, given better performance of AU in Q1, expecting on average a high 20s % decline YoY in each Market US Edu: Expected growth in the low single digits given softness in the cross-border business as we watch F1 Visa and other incoming data, while expecting strong Q1 signings and domestic wins The Healthcare business: High single digit expected growth YoY, mostly H2 from key client ramp Travel & B2B + UK and EMEA EDU: continued strong expected growth, though decelerating from prior year. Not flowing the travel Q1 revenue beat through for the remainder of the year Tougher YoY revenue comps in Q2 and Q3, easier in 4Q, which are factored into our full year guide Adjusted EBITDA margin expansion higher in Q1 vs H2 given timing of restructuring and investments, while managing opex and hiring in a data dependent manner, watching macro scenarios. FY 2025 Guidance Context: Revenue and Margins Q2 2025 Guidance Context ~(1%) negative impact to Q2 Revenue growth expected due to Easter timing. Lapping the Q1 to Q2 sequential acceleration last year. Assumes softer Canada and Australia performance in Q2 vs Q1. FX impact from US $ weakness in April vs 3/31 in guidance implies that Spot YY growth could be ~2pts higher than FXN YY growth in the quarter if current FX rates hold
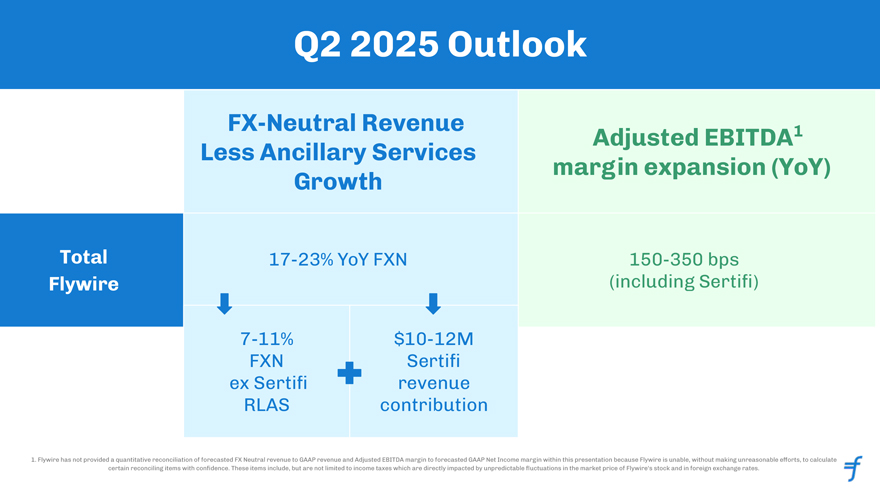
Q2 2025 Outlook FX-Neutral Revenue Less Ancillary Services Growth Adjusted EBITDA1 margin expansion (YoY) Total Flywire 17-23% YoY FXN 150-350 bps (including Sertifi) 7-11% FXN ex Sertifi RLAS $10-12M Sertifi revenue Contribution 1. Flywire has not provided a quantitative reconciliation of forecasted FX Neutral revenue to GAAP revenue and Adjusted EBITDA margin to forecasted GAAP Net Income margin within this presentation because Flywire is unable, without making unreasonable efforts, to calculate certain reconciling items with confidence. These items include, but are not limited to income taxes which are directly impacted by unpredictable fluctuations in the market price of Flywire’s stock and in foreign exchange rates.
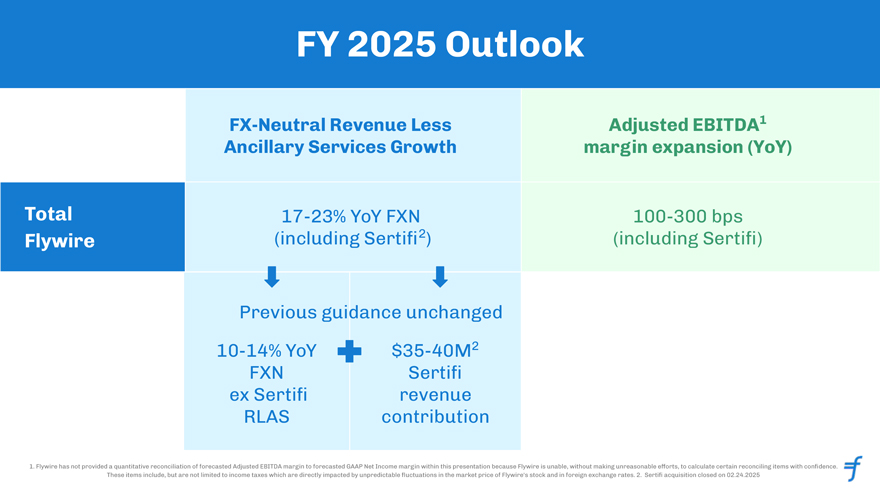
FY 2025 Outlook 1. Flywire has not provided a quantitative reconciliation of forecasted Adjusted EBITDA margin to forecasted GAAP Net Income margin within this presentation because Flywire is unable, without making unreasonable efforts, to calculate certain reconciling items with confidence. These items include, but are not limited to income taxes which are directly impacted by unpredictable fluctuations in the market price of Flywire’s stock and in foreign exchange rates. 2. Sertifi acquisition closed on 02.24.2025 FX-Neutral Revenue Less Ancillary Services Growth Adjusted EBITDA1 margin expansion (YoY) Total Flywire 17-23% YoY FXN (including Sertifi2) 100-300 bps (including Sertifi) 10-14% YoY FXN ex Sertifi RLAS $35-40M2 Sertifi revenue contribution Previous guidance unchanged

Capital Allocation and Structure
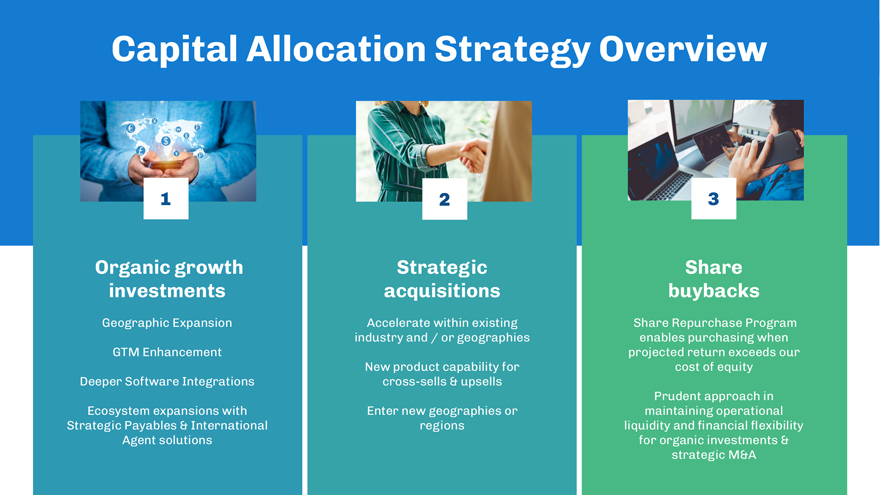
Capital Allocation Strategy Overview Organic growth investments Geographic Expansion GTM Enhancement Deeper Software Integrations Ecosystem expansions with Strategic Payables & International Agent solutions Strategic acquisitions Accelerate within existing industry and / or geographies New product capability for cross-sells & upsells Enter new geographies or regions Share buybacks Share Repurchase Program enables purchasing when projected return exceeds our cost of equity Prudent approach in maintaining operational liquidity and financial flexibility for organic investments & strategic M&A 1 2 3
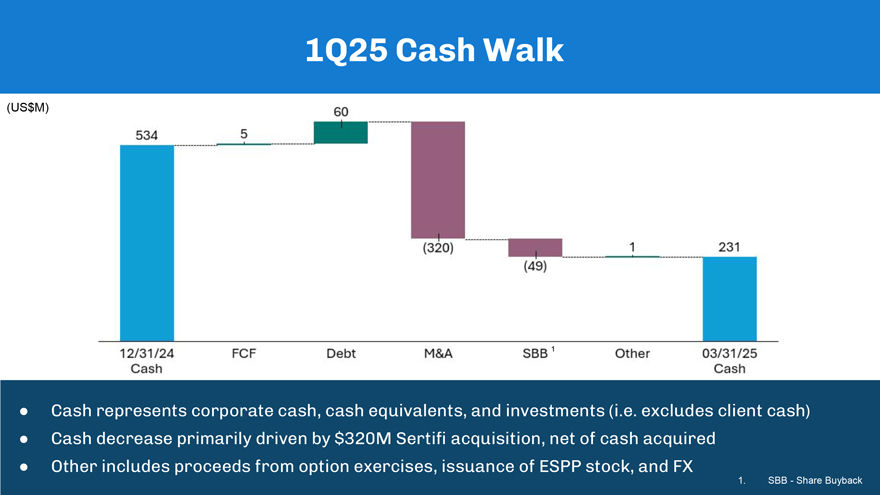
Cash represents corporate cash, cash equivalents, and investments (i.e. excludes client cash) Cash decrease primarily driven by $320M Sertifi acquisition, net of cash acquired Other includes proceeds from option exercises, issuance of ESPP stock, and FX (US$M) 1Q25 Cash Walk 1. SBB - Share Buyback 534 5 60 (320) (49) 1 231 12/31/24 Cash FCF Debt M&A SBB1 Other 03/31/25 Cash
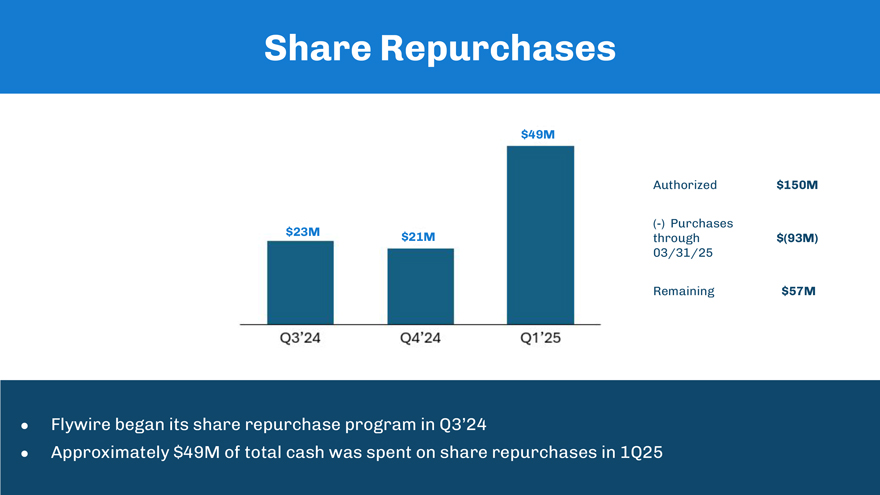
Share Repurchases Authorized $150M (-) Purchases through 03/31/25 $(93M) Remaining $57M Flywire began its share repurchase program in Q3’24 Approximately $49M of total cash was spent on share repurchases in 1Q25 $23M $21M $49M Q3’24 Q4’24 Q1’25

Appendix
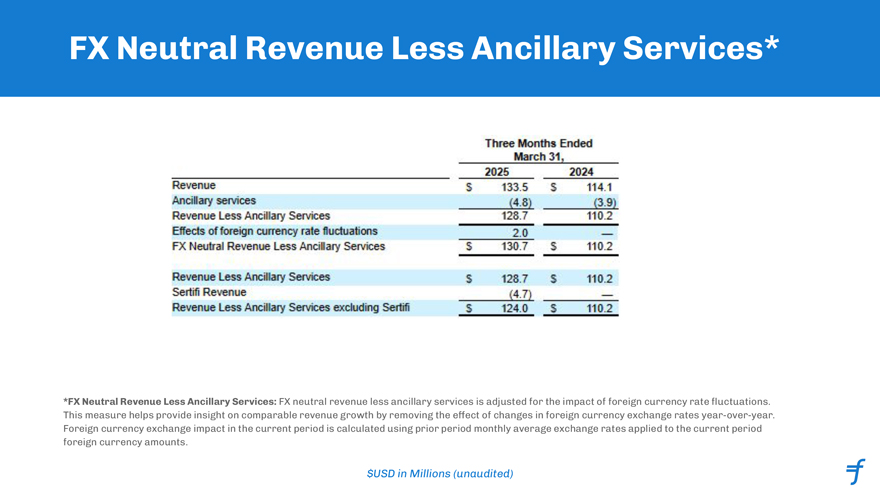
FX Neutral Revenue Less Ancillary Services* $USD in Millions (unaudited) *FX Neutral Revenue Less Ancillary Services: FX neutral revenue less ancillary services is adjusted for the impact of foreign currency rate fluctuations. This measure helps provide insight on comparable revenue growth by removing the effect of changes in foreign currency exchange rates year-over-year. Foreign currency exchange impact in the current period is calculated using prior period monthly average exchange rates applied to the current period foreign currency amounts. Three Months Ended March 31, 2025 2024 Revenue Ancillary services $ 133.5 $ 114.1 (4.8) (3.9) Revenue Less Ancillary Services 128.7 110.2 Effects of foreign currency rate fluctuations 2.0 FX Neutral Revenue Less Ancillary Services $ 130.7 $ 110.2 Revenue Less Ancillary Services $ 128.7 $ 110.2 Sertifi Revenue (4.7) Revenue Less Ancillary Services excluding Sertifi $ 124.0 $ 110.2
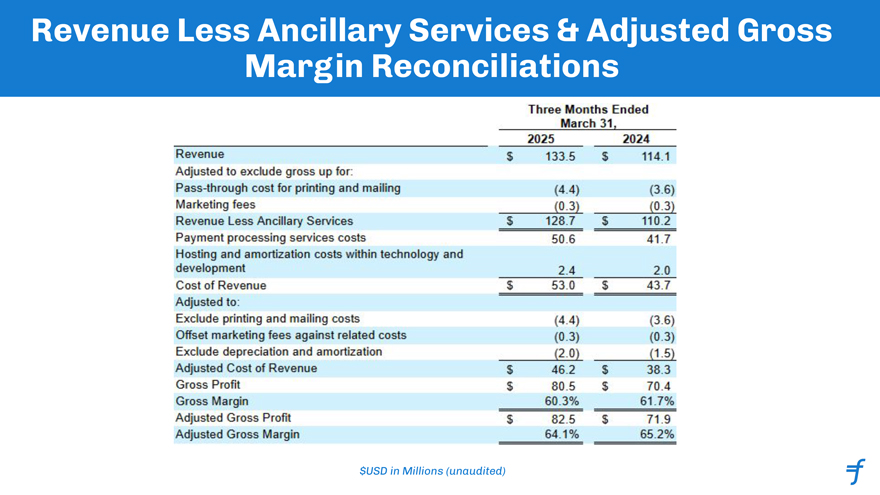
Revenue Less Ancillary Services & Adjusted Gross Margin Reconciliations $USD in Millions (unaudited) Three Months Ended March 31, 2025 2024 Revenue $ 133.5 $ 114.1 Adjusted to exclude gross up for: Pass-through cost for printing and mailing (4.4) (3.6) Marketing fees (0.3) (0.3) Revenue Less Ancillary Services $ 128.7 $ 110.2 Payment processing services costs 50.6 41.7 Hosting and amortization costs within technology and Development 2.4 2.0 Cost of Revenue $ 53.0 $ 43.7 Adjusted to: Exclude printing and mailing costs (4.4) (3.6) Offset marketing fees against related costs (0.3) (0.3) Exclude depreciation and amortization (2.0) (1.5) Adjusted Cost of Revenue $ 46.2 $ 38.3 Gross Profit $ 80.5 $ 70.4 Gross Margin 60.3% 61.7% Adjusted Gross Profit $ 82.5 $ 71.9 Adjusted Gross Margin 64.1% 65.2%
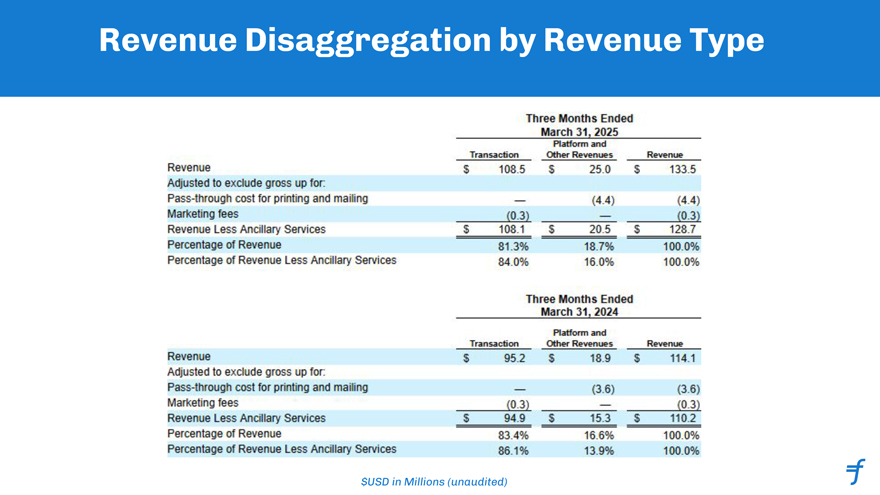
Revenue Disaggregation by Revenue Type $USD in Millions (unaudited) Three Months Ended March 31, 2025 Platform and Other Revenues Revenue Transaction $ 108.5 Pass-through cost for printing and mailing Adjusted to exclude gross up for: Marketing fees Revenue Less Ancillary Services Percentage of Revenue Percentage of Revenue Less Ancillary Services Revenue $ 25.0 $ 133.5 (4.4) (4.4) (0.3) (0.3) $ 108.1 $ 20.5 $ 128.7 81.3% 18.7% 100.0% 84.0% 16.0% 100.0% Three Months Ended March 31, 2024 Platform and Transaction Other Revenues Revenue Revenue $ 95.2 $ 18.9 $ 114.1 Adjusted to exclude gross up for: Pass-through cost for printing and mailing (3.6) (3.6) Marketing fees (0.3) (0.3) Revenue Less Ancillary Services $ 94.9 $ 15.3 $ 110.2 Percentage of Revenue 83.4% 16.6% 100.0% Percentage of Revenue Less Ancillary Services 86.1% 13.9% 100.0%
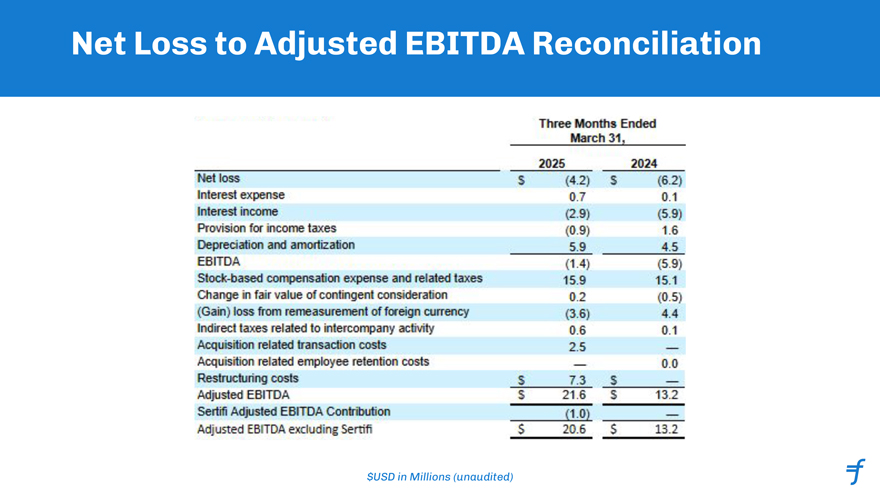
Net Loss to Adjusted EBITDA Reconciliation $USD in Millions (unaudited) Three Months Ended March 31, 2025 2024 Net loss Interest expense Interest income $ (4.2) $ (6.2) 0.7 0.1 (2.9) (5.9) Provision for income taxes (0.9) 1.6 Depreciation and amortization 5.9 4.5 EBITDA (1.4) (5.9) Stock-based compensation expense and related taxes Change in fair value of contingent consideration 15.9 15.1 0.2 (0.5) (Gain) loss from remeasurement of foreign currency (3.6) 4.4 Indirect taxes related to intercompany activity 0.6 0.1 Acquisition related transaction costs 2.5 Acquisition related employee retention costs 0.0 Restructuring costs S 7.3 $ Adjusted EBITDA $ 21.6 13.2 Sertifi Adjusted EBITDA Contribution (1.0) Adjusted EBITDA excluding Sertifi $ 20.6 $ 13.2
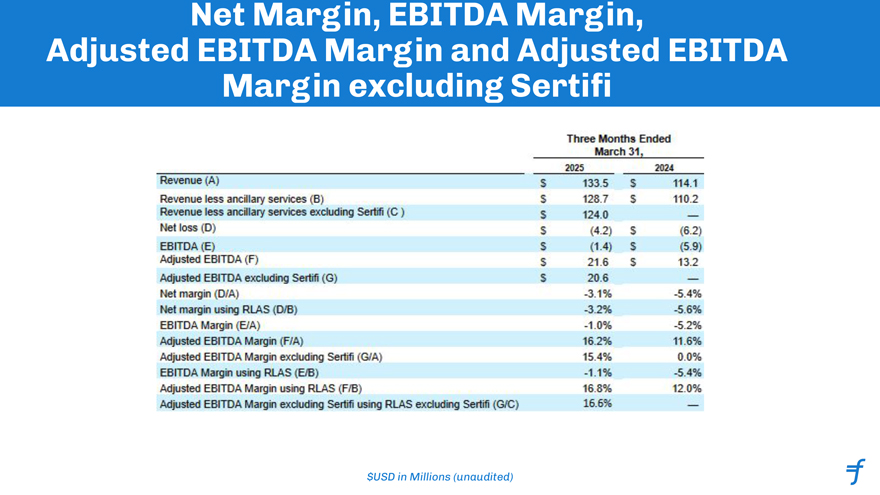
Net Margin, EBITDA Margin, Adjusted EBITDA Margin and Adjusted EBITDA Margin excluding Sertifi $USD in Millions (unaudited) Three Months Ended March 31, 2025 2024 Revenue (A) $ 133.5 $ 114.1 Revenue less ancillary services (B) $ 128.7 $ 110.2 Revenue less ancillary services excluding Sertifi (C) $ 124.0 Net loss (D) $ (4.2) EBITDA (E) $ (1.4) Adjusted EBITDA (F) $ 21.6 555 $ (6.2) $ (5.9) $13.2 Adjusted EBITDA excluding Sertifi (G) $ 20.6 Net margin (D/A) -3.1% -5.4% Net margin using RLAS (D/B) -3.2% -5.6% EBITDA Margin (E/A) -1.0% -5.2% Adjusted EBITDA Margin (F/A) 16.2% 11.6% Adjusted EBITDA Margin excluding Sertifi (G/A) 15.4% 0.0% EBITDA Margin using RLAS (E/B) -1.1% -5.4% Adjusted EBITDA Margin using RLAS (F/B) 16.8% 12.0% Adjusted EBITDA Margin excluding Sertifi using RLAS excluding Sertifi (G/C) 16.6%
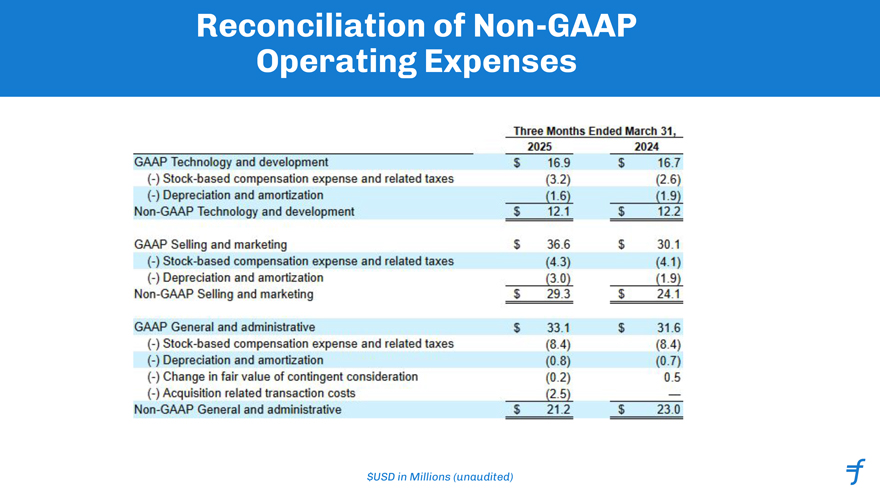
Reconciliation of Non-GAAP Operating Expenses $USD in Millions (unaudited) Three Months Ended March 31, 2025 2024 GAAP Technology and development $ 16.9 $ 16.7 (-) Stock-based compensation expense and related taxes (-) Depreciation and amortization (3.2) (2.6) (1.6) (1.9) Non-GAAP Technology and development $ 12.1 $ 12.2 GAAP Selling and marketing $ 36.6 $ 30.1 (-) Stock-based compensation expense and related taxes (4.3) (4.1) (-) Depreciation and amortization (3.0) (1.9) Non-GAAP Selling and marketing $ 29.3 $ 24.1 GAAP General and administrative $ 33.1 $ 31.6 (-) Stock-based compensation expense and related taxes (8.4) (8.4) (-) Depreciation and amortization (0.8) (0.7) (-) Change in fair value of contingent consideration (0.2) 0.5 (-) Acquisition related transaction costs (2.5) Non-GAAP General and administrative $ 21.2 $ 23.0