
UNITED STATES
SECURITIES AND EXCHANGE COMMISSION
Washington, D.C. 20549
_________________________________________________________
FORM 8-K
_________________________________________________________
CURRENT REPORT
Pursuant to Section 13 or 15(d)
of the Securities Exchange Act of 1934
Date of Report (Date of earliest event reported): November 3, 2026
_________________________________________________________
(Exact name of Registrant as specified in its charter)
_________________________________________________________
(State or other jurisdiction of incorporation) | (Commission File No.) | (IRS Employer Identification No.) | ||||||
(Address of principal executive offices and zip code)
Registrant’s telephone number, including area code: (617 ) 329-4524
Not Applicable
(Former Name or Former Address, if Changed Since Last Report)
_________________________________________________________
Check the appropriate box below if the Form 8-K filing is intended to simultaneously satisfy the filing obligation of the registrant under any of the following provisions:
| Written communications pursuant to Rule 425 under the Securities Act (17 CFR 230.425) | |||||
| Soliciting material pursuant to Rule 14a-12 under the Exchange Act (17 CFR 240.14a-12) | |||||
| Pre-commencement communications pursuant to Rule 14d-2(b) under the Exchange Act (17 CFR 240.14d-2(b)) | |||||
| Pre-commencement communications pursuant to Rule 13e-4(c) under the Exchange Act (17 CFR 240.13e-4(c)) | |||||
Securities registered pursuant to Section 12(b) of the Act:
| Title of each class | Trading Symbol(s) | Name of each exchange on which registered | ||||||
| (Nasdaq Global Select Market) | ||||||||
Indicate by check mark whether the registrant is an emerging growth company as defined in Rule 405 of the Securities Act of 1933 (§230.405 of this chapter) or Rule 12b-2 of the Securities Exchange Act of 1934 (§240.12b-2 of this chapter).
Emerging growth company ☐
If an emerging growth company, indicate by check mark if the registrant has elected not to use the extended transition period for complying with any new or revised financial accounting standards provided pursuant to Section 13(a) of the Exchange Act. ☐
| Item 2.02. | Results of Operations and Financial Condition. | ||||
On November 3, 2026, Flywire Corporation (“Flywire” or the “Company”) issued a press release (the “Press Release”) and is holding a conference call regarding its preliminary and unaudited financial results for the quarter ended September 30, 2026. The Press Release is furnished as Exhibit 99.1 to this Current Report on Form 8-K and is incorporated by reference herein.
Various statements to be made during the conference call are “forward-looking statements” within the meaning of the Private Securities Litigation Reform Act of 1995, including, but not limited to, statements regarding Flywire’s future operating results and financial position, Flywire’s business strategy and plans, market growth, and Flywire’s objectives for future operations. Flywire intends such forward-looking statements to be covered by the safe harbor provisions for forward-looking statements contained in Section 21E of the Securities Exchange Act of 1934 and the Private Securities Litigation Reform Act of 1995. In some cases, you can identify forward-looking statements by terms such as, but not limited to, “believe,” “may,” “will,” “potentially,” “estimate,” “continue,” “anticipate,” “intend,” “could,” “would,” “project,” “target,” “plan,” “expect,” or the negative of these terms, and similar expressions intended to identify forward-looking statements. Such forward-looking statements are based upon current expectations that involve risks, changes in circumstances, assumptions, and uncertainties. Important factors that could cause actual results to differ materially from those reflected in Flywire’s forward-looking statements include, among others, Flywire’s future financial performance, including its expectations regarding FX Neutral Revenue Less Ancillary Services growth, Adjusted EBITDA margin growth and foreign exchange rates. Risks that may cause actual results to differ materially from these forward looking statements include, but are not limited to: Flywire’s ability to execute its business plan and effectively manage its growth; Flywire’s cross-border expansion plans and ability to expand internationally; anticipated trends, growth rates, and challenges in Flywire’s business and in the markets in which Flywire operates; the sufficiency of Flywire’s cash and cash equivalents to meet its liquidity needs; political, economic, foreign currency exchange rate, inflation, legal, social and health risks, that may affect Flywire’s business or the global economy; Flywire’s beliefs and objectives for future operations; Flywire’s ability to develop and protect its brand; Flywire’s ability to maintain and grow the payment volume that it processes; Flywire’s ability to further attract, retain, and expand its client base; Flywire’s ability to develop new solutions and services and bring them to market in a timely manner; Flywire’s expectations concerning relationships with third parties, including financial institutions and strategic partners; the effects of increased competition in Flywire’s markets and its ability to compete effectively; estimates of market opportunity and our ability to capture a meaningful share of this payment volume may prove to be inaccurate; recent and future acquisitions or investments in complementary companies, products, services, or technologies; uncertainties associated with the timing and scope of future repurchases by Flywire of its common stock under its repurchase program, which may be discontinued, accelerated, suspended or delayed at any time due to various factors, including market conditions and the level of other investing activities and uses of cash; Flywire’s ability to enter new client verticals, including its relatively new hospitality and business-to-business sector; Flywire’s expectations regarding anticipated technology needs and developments and its ability to address those needs and developments with its solutions; Flywire’s use of artificial intelligence may result in operational challenges, legal liability, reputational harm, competitive risks and enhanced regulatory and fraud concerns; Flywire’s expectations regarding its ability to meet existing performance obligations and maintain the operability of its solutions; Flywire’s expectations regarding the effects of existing and developing laws and regulations, including with respect to payments and financial services, taxation, privacy and data protection; Flywire’s ability to adapt its business to changes in government policy regarding tariffs and immigration; economic and industry trends, including the risk of a global recession, projected growth, or trend analysis; the effects of global events and geopolitical conflicts, including without limitation the ongoing hostilities in Ukraine and involving Israel, Hamas, the U.S. and Iran; Flywire’s ability to adapt to recommended or implemented U.S. policy changes, in particular those that impact higher education, the desire for foreign students to study in the U.S., immigration and visa policy, and changes to regulatory agencies and depth of enforcement of regulations; Flywire’s ability to adapt to changes in U.S. federal income or other tax laws or the interpretation of tax laws, including the Inflation Reduction Act of 2022 and The One Big Beautiful Bill Act of 2025; Flywire’s ability to attract and retain qualified employees; Flywire’s ability to maintain, protect, and enhance its intellectual property; Flywire’s ability to maintain the security and availability of its solutions; the increased expenses associated with being a public company; the future market price of Flywire’s common stock; and other factors that are described in the “Risk Factors” and “Management’s Discussion and Analysis of Financial Condition and Results of Operations” sections of Flywire’s Annual Report on Form 10-K for the year ended December 31, 2025 and Quarterly Report on Form 10-Q for the quarter ended June 30, 2026, which are on file with the Securities and Exchange Commission (SEC) and available on the SEC’s website at https://www.sec.gov/. Additional factors may be described in those sections of Flywire’s Quarterly Report on Form 10-Q for the quarter ended September 30, 2026, expected to be filed in the fourth quarter of 2026. The information conveyed on the conference call is provided only as of the date of the conference call, and Flywire undertakes no obligation to update any forward-looking
statements presented during the conference call on account of new information, future events, or otherwise, except as required by law.
| Item 5.02. | Departure of Directors or Certain Officers; Election of Directors; Appointment of Certain Officers; Compensatory Arrangements of Certain Officers. | ||||
(b) On October 29, 2026, Alex Finkelstein (“Mr. Finkelstein”) informed the Board of Directors (the “Board”) of Flywire that he was resigning as a member of the Board effective immediately. Prior to his resignation Mr. Finkelstein served on the Audit Committee of the Board. Mr. Finkelstein’s resignation was not due to any dispute or disagreement with Flywire or any matter related to its operations, policies or practices. In connection with the resignation of Mr. Finkelstein, pursuant to Flywire’s bylaws and certificate of incorporation the Board has decreased the number of directors from ten to nine.
| Item 7.01. | Regulation FD Disclosure. | ||||
On November 3, 2026, the Company provided an investor presentation that will be made available on the investor relations section of the Company’s website at https://ir.flywire.com/. The investor presentation is furnished as Exhibit 99.2 to this Current Report on Form 8-K and is incorporated by reference herein.
This information in this Item 7.01 of this Current Report on Form 8-K shall not be deemed “filed” for purposes of Section 18 of the Securities Exchange Act of 1934, as amended (the “Exchange Act”), or otherwise subject to the liabilities of that Section, or incorporated by reference in any filing under the Securities Act of 1933, as amended, or the Exchange Act, except as shall be expressly set forth by specific reference in any such filing.
| Item 9.01. | Financial Statements and Exhibits. | ||||
(d) Exhibits
| Exhibit No. | Description | ||||
| 99.1 | |||||
| 99.2 | |||||
| 104 | Cover Page Interactive Data File (embedded within the Inline XBRL document) | ||||
SIGNATURE
Pursuant to the requirements of the Securities Exchange Act of 1934, the registrant has duly caused this report to be signed on its behalf by the undersigned hereunto duly authorized.
| FLYWIRE CORPORATION | ||||||||
| By: | /s/ Cosmin Pitigoi | |||||||
| Name: | Cosmin Pitigoi | |||||||
| Title: | Chief Financial Officer | |||||||
Dated November 3, 2026
Exhibit 99.1
Flywire Reports Third Quarter 2026 Financial Results
Third Quarter Revenue Increased 25.1% Year-over-Year
Third Quarter Revenue Less Ancillary Services Increased 26.0% Year-over-Year
Previous Fiscal Year 2026 FX-Neutral Revenue Less Ancillary Services growth guidance raised by 2 pts at midpoint, Adjusted EBITDA margin growth guidance raised by 30 bps at midpoint
Boston, MA – November 3, 2026: Flywire Corporation (Nasdaq: FLYW) (“Flywire” or the “Company”), a global payments enablement and software company, today reported financial results for its Third quarter ended September 30, 2026.
“Q3 showed the sustainability of our growth. Through our seasonal education peak, we delivered strong top-line growth with disciplined execution across all four verticals. The financial profile reflects it: expanding adjusted EBITDA margins, and more profit and free cash flow than at any point in our history. That gives us real choices, and the best returns we see today are in our own business: deepening our competitive moat, gaining share and solving complex, high-friction financial workflows around the world," said Mike Massaro, Flywire’s CEO.
Third Quarter 2026 Financial Highlights:
GAAP Results
●Revenue increased 25.1% to $250.3 million in the Third quarter of 2026, compared to $200.1 million in the Third quarter of 2025.
●Gross Profit increased to $152.7 million, resulting in Gross Margin of 61.0%, for the Third quarter of 2026, compared to Gross Profit of $124.7 million and Gross Margin of 62.3% in the Third quarter of 2025.
●Net income was $74.5 million in the Third quarter of 2026, compared to net income of $29.6 million in the Third quarter of 2025. Third quarter 2026 net income reflects a non-cash income tax benefit of approximately $39.2 million from the release of the valuation allowance against the Company's U.S. deferred tax assets. The main driver in the $22.2 million Q3 income tax benefit is $27 million of Q3 discrete items (the largest being release of the U.S. valuation allowance of $25.2 million) offset by non-U.S. foreign tax expense. The Company does not expect a benefit of this nature or size to recur in future periods, and third quarter 2026 net income is not indicative of future results.
Key Operating Metrics and Non-GAAP Results
●Total Payment Volume increased 27.7% to $17.8 billion in the Third quarter of 2026, compared to $13.9 billion in the Third quarter of 2025.
●Revenue Less Ancillary Services increased 26.0% to $244.5 million in the Third quarter of 2026, compared to $194.1 million in the Third quarter of 2025. FX-Neutral Revenue Less Ancillary Services increased 26.0% year-over-year.
●Adjusted Gross Profit increased to $155.8 million, up 22.2% compared to $127.5 million in the Third quarter of 2025. Adjusted Gross Margin was 63.7% in the Third quarter of 2026 compared to 65.7% in the Third quarter of 2025.
●Adjusted EBITDA increased 39.2% to $79.5 million in the Third quarter of 2026, compared to $57.1 million in the Third quarter of 2025. Adjusted EBITDA margin increased by approximately 310 bps year-over-year to 32.5% in the Third quarter of 2026.
Q3 2026 Key Business Performance highlights:
Commercial Highlights
-Strategic Enterprise Wins & SFS Expansion: Expansion of our Student Financial Software (SFS) in the U.S. and U.K. continues our shift toward larger, more strategic engagements. In the quarter, we signed SFS agreements with three prominent U.S. universities and one U.K. institution. At our third annual client conference for U.S. institutions, we announced that more than 1 million payment plans have been activated since inception by students at US institutions using SFS.
-Strong Deal Velocity & Geographic Diversification: This quarter we signed approximately 180 new clients across 31 countries and all four verticals, with our go-to-market teams deliberately prioritizing larger, higher-ARR enterprise relationships.
-International Momentum in Travel: Flywire’s Hospitality business continued to gain traction across APAC, including a pilot with Langham Hospitality Group and further expansion in Australia. In EMEA, secured approval for a 24-property rollout with Kingfisher following a successful pilot, and won 23 Marriott Sign & Pay deals.
-B2B Enterprise Scaling: Major B2B wins such as Liquidity Services Inc. deploying Flywire to power domestic and cross-border payments for its $1.5 billion global e-commerce marketplace.
-Healthcare Expansion: Completed key upsells, including a major one with Endeavor Health for our Integrated Financing solution.
-Asset acquisition of customer relationships in Canada to transition a portfolio of higher education institutions to Flywire.
Product & Partner Highlights
●Global Payment Network Expansion: Expanded and continued to optimize our global payment network to deliver stronger local payment experiences across markets and verticals. We added new local payment options in China, Japan and Türkiye. In China, we saw strong momentum with UnionPay, ran new promotions through Bank of China,
and we deepened our partnership with Antom, a merchant payment and digitisation services provider under Ant International, to enable Alipay payments beyond education into cross-border travel.In India, we launched real-time payment confirmations, so families making high-value tuition payments can see instantly that their money has arrived.
●Strategic Student Accommodations Partnership: Became the Global Preferred Payment Partner for Kinetic Software, a leading technology provider to higher education and student accommodation operators in more than 20 countries. Kinetic manages over 700,000 student bedrooms and is trusted by more than 80% of top U.K. universities. The partnership gives Flywire a scaled channel into global education and student housing payments.
●Invoiced Industry Recognition for Invoice To Cash Solution: Named a Leader in Nucleus Research’s 2026 Accounts Receivable Technology Value Matrix. The report cited how Invoiced combines automated invoice-to-cash software and multi-agent AI (CashMatch AI and Smart Chasing) with Flywire’s proprietary global payment network, which spans more than 140 currencies and over 240 countries and territories.
Guidance
”We delivered another quarter of disciplined execution during our highest-volume peak, exceeding guidance across revenue-less ancillary services, and Adjusted EBITDA while generating robust free cash flow and sustained GAAP profitability. With strong execution across all verticals, we are raising our full-year 2026 outlook across revenue growth and adjusted EBITDA margin expansion. We have been GAAP profitable before, but this quarter marked a step change in scale of our GAAP profitability. This is true even when adjusting for a one-time, non-cash tax benefit tied to the release of our U.S. valuation allowance." - said Flywire's CFO, Cosmin Pitigoi.
In setting our Q4 outlook, we have appropriately factored in prudent visa assumptions across the big 4 education markets and B2B payment trends. Based on information available as of November 3, 2026, Flywire anticipates the following results for the fourth quarter and fiscal year 2026*.
Fiscal Year 2026 | |||||
FX-Neutral Revenue Less Ancillary Services Growth | 25-27% YoY | ||||
Adjusted EBITDA Margin Growth | +300 to 360 bps YoY | ||||
Fourth Quarter 2026 | |||||
FX-Neutral Revenue Less Ancillary Services Growth | 14-20% YoY | ||||
| Adjusted EBITDA Margin Growth | 330-530 bps YoY | ||||
*Flywire has not provided a quantitative reconciliation of forecasted FX-Neutral Revenue Less Ancillary Services Growth to forecasted GAAP Revenue Growth or forecasted Adjusted EBITDA Margin Growth to forecasted GAAP Net Income Margin Growth or to forecasted GAAP net income (loss) before income taxes growth within this earnings release because Flywire is unable, without making unreasonable efforts, to calculate certain reconciling items with confidence. These items include, but are not limited to, income taxes, which are directly impacted by unpredictable fluctuations in the market price of Flywire's stock and foreign currency exchange rates.
These statements are forward-looking, and actual results may differ materially. Refer to the “Safe Harbor Statement” below for information on the factors that could cause Flywire’s actual results to differ materially from these forward-looking statements.
Board of Directors Update
Flywire also announced today that Alex Finkelstein has resigned from the Company’s Board of Directors, effective October 29, 2026. Mr. Finkelstein has served on Flywire’s Board since 2011, having led Spark Capital’s initial investment in the Company and provided steadfast strategic guidance and leadership from Flywire's earliest days through its global expansion and IPO. The Company, the Board of Directors, and the executive leadership team extend their deepest gratitude to Alex for his 15 years of exceptional dedication, vision, and service to Flywire.
As previously announced, Flywire has appointed Sabrina Farmer to its Board of Directors. Ms. Farmer has spent the last 25 years in technology leadership roles at some of the world's most innovative companies, including as VP of Engineering for Core Infrastructure at Google and CTO of GitLab. She now leads the Commerce Platform at Microsoft. Her deep knowledge of infrastructure resilience, operational excellence, and technical leadership will be invaluable to Flywire.
Conference Call
The Company will host a conference call to discuss Third quarter financial results today at 5:00 pm ET. Hosting the call will be Mike Massaro, CEO, Rob Orgel, President and COO, and Cosmin Pitigoi, CFO. The conference call can be accessed live via webcast from the Company's investor relations website at https://ir.flywire.com/. A replay will be available on the investor relations website following the call.
Note Regarding Share Repurchase Program
Repurchases under the Company’s share repurchase program (the Repurchase Program) may be made from time to time through open market purchases, in privately negotiated transactions or by other means, including through accelerated share repurchase transactions or the use of trading plans intended to qualify under Rule 10b5-1 under the Securities Exchange Act of 1934, as amended, in accordance with applicable securities laws and other restrictions, including Rule 10b-18. The timing, value and number of shares repurchased will be determined by the Company in its discretion and will be based on various factors, including an evaluation of current and future capital needs, current and forecasted cash flows, the Company’s capital structure, cost of capital and prevailing stock prices, general market and economic conditions, applicable legal requirements, and compliance with covenants in the Company’s credit facility that may limit share repurchases based on defined leverage ratios. The Repurchase Program does not obligate the Company to purchase a specific number of, or any, shares. The Repurchase Program does not expire and may be modified, suspended, or terminated at any time without notice at the Company’s discretion.
Key Operating Metrics and Non-GAAP Financial Measures
Flywire uses non-GAAP financial measures to supplement financial information presented on a GAAP basis. The Company believes that excluding certain items from its GAAP results allows management to better understand its consolidated financial performance from period to period and better project its future consolidated financial performance as forecasts are developed at a level of detail different from that used to prepare GAAP-based financial measures. Moreover, Flywire believes these non-GAAP financial measures provide its stakeholders with useful information to help them evaluate the Company’s operating results by facilitating an enhanced understanding of the Company’s operating performance and enabling them to make more meaningful period-to-period comparisons. There are limitations to the use of the non-GAAP financial measures presented here. Flywire’s non-GAAP financial measures may not be comparable to similarly titled measures of other companies. Other companies, including companies in Flywire’s industry, may calculate non-GAAP financial measures differently, limiting the usefulness of those measures for comparative purposes.
Flywire uses supplemental measures of its performance, which are derived from its consolidated financial information, but which are not presented in its consolidated financial statements prepared in accordance with GAAP. These non-GAAP financial measures include the following:
●Revenue Less Ancillary Services. Revenue Less Ancillary Services represents the Company’s consolidated revenue in accordance with GAAP less (i) pass-through cost
for printing and mailing services and (ii) marketing fees. The Company excludes these amounts to arrive at this supplemental non-GAAP financial measure as it views these services as ancillary to the primary services it provides to its clients.
●Adjusted Gross Profit and Adjusted Gross Margin. Adjusted gross profit represents Revenue Less Ancillary Services less cost of revenue adjusted to (i) exclude pass-through cost for printing services, (ii) offset marketing fees against costs incurred and (iii) exclude depreciation and amortization, including accelerated amortization on the impairment of customer set-up costs tied to technology integration, if applicable. Adjusted Gross Margin represents Adjusted Gross Profit divided by Revenue Less Ancillary Services. Management believes this presentation supplements the GAAP presentation of Gross Profit and Gross Margin with a useful measure of the gross profit and gross margin of the Company’s payment processing-related services, which are the primary services it provides to its clients.
●Adjusted EBITDA. EBITDA represents our consolidated net income (loss) in accordance with GAAP adjusted to exclude (i) interest expense, (ii) interest income, (iii) provision for (benefit from) income taxes and (iv) depreciation and amortization. Adjusted EBITDA represents EBITDA further adjusted by excluding (a) stock-based compensation expense and related payroll taxes, (b) the impact from the change in fair value measurement for contingent consideration associated with acquisitions,(c) gain (loss) from the remeasurement of foreign currency, (d) indirect taxes related to intercompany activity, (e) acquisition related transaction costs, (f) employee retention costs, such as incentive compensation, associated with acquisition activities, (g) restructuring costs, and (h) gain (loss) from investments. Management believes that the exclusion of these amounts to calculate Adjusted EBITDA provides useful measures for period-to-period comparisons of the Company’s business.
●Adjusted EBITDA Margin. Adjusted EBITDA Margin represents Adjusted EBITDA divided by Revenue Less Ancillary Services. Management believes this presentation supplements the GAAP presentation of net income margin with a useful measure of the profitability of our core operations, excluding the pass-through ancillary services revenue and the items excluded from Adjusted EBITDA described above.
●FX Neutral Revenue Less Ancillary Services. FX Neutral Revenue Less Ancillary Services represents Revenue Less Ancillary Services adjusted to show presentation on a FX Neutral basis. The FX Neutral information presented is calculated by translating current-period results using prior-period weighted average foreign currency exchange rates. Flywire analyzes Revenue Less Ancillary Services on an FX Neutral basis to provide a comparable framework for assessing how the business performed, excluding the effect of foreign currency fluctuations.
●Non-GAAP Operating Expenses. Non-GAAP Operating Expenses represents GAAP Operating Expenses adjusted by excluding (i) stock-based compensation expense and related payroll taxes, (ii) depreciation and amortization, (iii) acquisition related transaction costs, if applicable, (iv) employee retention costs, such as incentive compensation, associated with acquisition activities, (v) the impact from the change in
fair value measurement for contingent consideration associated with acquisitions and (vi) restructuring costs.
These non-GAAP financial measures are not meant to be considered as indicators of performance in isolation from or as a substitute for the Company’s revenue, gross profit, gross margin or net income (loss), or operating expenses prepared in accordance with GAAP and should be read only in conjunction with financial information presented on a GAAP basis. Reconciliations of these non-GAAP financial measures to the most directly comparable GAAP financial measure are presented below. Flywire encourages you to review these reconciliations in conjunction with the presentation of the non-GAAP financial measures for each of the periods presented. In future fiscal periods, Flywire may exclude such items and may incur income and expenses similar to these excluded items.
Flywire has not provided a quantitative reconciliation of forecasted FX-Neutral Revenue Less Ancillary Services Growth to forecasted GAAP Revenue Growth or forecasted Adjusted EBITDA Margin Growth to forecasted GAAP Net Income Margin Growth or to forecasted GAAP net income (loss) before income taxes growth within this earnings release because it is unable, without making unreasonable efforts, to calculate certain reconciling items with confidence. These items include, but are not limited to, income taxes, which are directly impacted by unpredictable fluctuations in the market price of Flywire's stock and foreign currency exchange rates. For figures in this press release reported on an "FX-Neutral basis,” Flywire calculates the year-over-year impact of foreign currency movements using prior period weighted average foreign currency exchange rates.
About Flywire
Flywire is a global payments enablement and software company. We combine our proprietary global payments network, next-gen payments platform and vertical-specific software to deliver the most important and complex payments for our clients and their customers.
Flywire leverages its vertical-specific software and payments technology to deeply embed within the existing A/R workflows for its clients across the education, healthcare, and travel vertical markets, as well as in key B2B industries. Flywire also integrates with leading ERP systems, such as NetSuite, so organizations can optimize the payment experience for their customers while eliminating operational challenges.
Flywire supports approximately 5,400** clients with diverse payment methods in more than 140 currencies across more than 240 countries and territories around the world. Flywire is headquartered in Boston, MA, USA, with global offices. For more information, visit www.flywire.com. Follow Flywire on X (formerly known as Twitter), LinkedIn and Facebook.
**Excludes clients from Flywire’s Sertifi and Invoiced acquisitions
Safe Harbor Statement
This release contains forward-looking statements within the meaning of the Private Securities
Litigation Reform Act of 1995, including, but not limited to, statements regarding Flywire’s future operating results and financial position, Flywire’s business strategy and plans, market growth, and Flywire’s objectives for future operations. Flywire intends such forward-looking statements to be covered by the safe harbor provisions for forward-looking statements contained in Section 21E of the Securities Exchange Act of 1934 and the Private Securities Litigation Reform Act of 1995. In some cases, you can identify forward-looking statements by terms such as, but not limited to, “believe,” “may,” “will,” “potentially,” “estimate,” “continue,” “anticipate,” “intend,” “could,” “would,” “project,” “target,” “plan,” “expect,” or the negative of these terms, and similar expressions intended to identify forward-looking statements. Such forward-looking statements are based upon current expectations that involve risks, changes in circumstances, assumptions, and uncertainties. Important factors that could cause actual results to differ materially from those reflected in Flywire's forward-looking statements include, among others, Flywire’s future financial performance, including its expectations regarding FX Neutral Revenue Less Ancillary Services growth, Adjusted EBITDA margin growth and foreign exchange rates. Risks that may cause actual results to differ materially from these forward looking statements include, but are not limited to: Flywire’s ability to execute its business plan and effectively manage its growth; Flywire’s cross-border expansion plans and ability to expand internationally; anticipated trends, growth rates, and challenges in Flywire’s business and in the markets in which Flywire operates; the sufficiency of Flywire’s cash and cash equivalents to meet its liquidity needs; political, economic, foreign currency exchange rate, inflation, legal, social and health risks, that may affect Flywire’s business or the global economy; Flywire’s beliefs and objectives for future operations; Flywire’s ability to develop and protect its brand; Flywire’s ability to maintain and grow the payment volume that it processes; Flywire’s ability to further attract, retain, and expand its client base; Flywire’s ability to develop new solutions and services and bring them to market in a timely manner; Flywire’s expectations concerning relationships with third parties, including financial institutions and strategic partners; the effects of increased competition in Flywire’s markets and its ability to compete effectively; estimates of market opportunity and our ability to capture a meaningful share of this payment volume may prove to be inaccurate; recent and future acquisitions or investments in complementary companies, products, services, or technologies; uncertainties associated with the timing and scope of future repurchases by Flywire of its common stock under its repurchase program, which may be discontinued, accelerated, suspended or delayed at any time due to various factors, including market conditions and the level of other investing activities and uses of cash; Flywire’s ability to enter new client verticals, including its relatively new hospitality and business-to-business sector; Flywire’s expectations regarding anticipated technology needs and developments and its ability to address those needs and developments with its solutions; Flywire’s use of artificial intelligence may result in operational challenges, legal liability, reputational harm, competitive risks and enhanced regulatory and fraud concerns; Flywire’s expectations regarding its ability to meet existing performance obligations and maintain the operability of its solutions; Flywire’s expectations regarding the effects of existing and developing laws and regulations, including with respect to payments and financial services, taxation, privacy and data protection; Flywire’s ability to adapt its business to changes in government policy regarding tariffs and immigration; economic and industry trends, including the risk of a global recession, projected growth, or trend analysis; the effects of global events and geopolitical conflicts, including without limitation the ongoing hostilities in Ukraine
and involving Israel, Hamas, the U.S. and Iran; Flywire’s ability to adapt to recommended or implemented U.S. policy changes, in particular those that impact higher education, the desire for foreign students to study in the U.S., immigration and visa policy, and changes to regulatory agencies and depth of enforcement of regulations; Flywire’s ability to adapt to changes in U.S. federal income or other tax laws or the interpretation of tax laws, including the Inflation Reduction Act of 2022 and The One Big Beautiful Bill Act of 2025; Flywire’s ability to attract and retain qualified employees; Flywire’s ability to maintain, protect, and enhance its intellectual property; Flywire’s ability to maintain the security and availability of its solutions; the increased expenses associated with being a public company; the future market price of Flywire’s common stock; and other factors that are described in the "Risk Factors" and "Management's Discussion and Analysis of Financial Condition and Results of Operations" sections of Flywire's Annual Report on Form 10-K for the year ended December 31, 2025 and Quarterly Report on Form 10-Q for the quarter ended June 30, 2026, which are on file with the Securities and Exchange Commission (SEC) and available on the SEC's website at https://www.sec.gov/. Additional factors may be described in those sections of Flywire’s Quarterly Report on Form 10-Q for the quarter ended September 30, 2026, expected to be filed in the fourth quarter of 2026. The information in this release is provided only as of the date of this release, and Flywire undertakes no obligation to update any forward-looking statements contained in this release on account of new information, future events, or otherwise, except as required by law.
Contacts
Investor Relations:
Masha Kahn
ir@Flywire.com
Media:
Sarah King
Media@Flywire.com
Condensed Consolidated Statements of Operations and Comprehensive Income
(Unaudited) (Amounts in thousands, except share and per share amounts)
| Three Months Ended September 30, | Nine Months Ended September 30, | ||||||||||||||||||||||
| 2026 | 2025 | 2026 | 2025 | ||||||||||||||||||||
| Revenue | $ | 250,300 | $ | 200,138 | $ | 606,156 | $ | 465,481 | |||||||||||||||
| Costs and operating expenses: | |||||||||||||||||||||||
| Payment processing services costs | 93,989 | 72,318 | 246,188 | 176,768 | |||||||||||||||||||
| Technology and development | 16,652 | 17,650 | 54,472 | 51,667 | |||||||||||||||||||
| Selling and marketing | 42,570 | 41,911 | 121,975 | 116,857 | |||||||||||||||||||
| General and administrative | 44,330 | 36,006 | 122,750 | 99,239 | |||||||||||||||||||
| Restructuring | — | — | — | 8,690 | |||||||||||||||||||
| Total costs and operating expenses | 197,541 | 167,885 | 545,385 | 453,221 | |||||||||||||||||||
| Income from operations | $ | 52,759 | $ | 32,253 | $ | 60,771 | $ | 12,260 | |||||||||||||||
| Other (expense) income: | |||||||||||||||||||||||
| Interest expense | (463) | (1,197) | (1,079) | (2,986) | |||||||||||||||||||
| Interest income | 506 | 769 | 2,077 | 4,792 | |||||||||||||||||||
| (Loss) gain from remeasurement of foreign currency | (451) | (626) | (47) | 6,897 | |||||||||||||||||||
| Gain on available-for-sale debt securities | 3 | — | 3 | 166 | |||||||||||||||||||
| Total other (expense) income, net | (405) | (1,054) | 954 | 8,869 | |||||||||||||||||||
| Income before income taxes | 52,354 | 31,199 | 61,725 | 21,129 | |||||||||||||||||||
| (Benefit from) provision for income taxes | (22,189) | 1,568 | (17,189) | 7,665 | |||||||||||||||||||
| Net income | $ | 74,543 | $ | 29,631 | $ | 78,914 | $ | 13,464 | |||||||||||||||
| Foreign currency translation adjustment | 1,176 | (1,917) | 3,152 | 7,415 | |||||||||||||||||||
| Unrealized (losses) gains on available-for-sale debt securities, net of taxes | (7) | 20 | (54) | (145) | |||||||||||||||||||
| Total other comprehensive income (loss) | $ | 1,169 | $ | (1,897) | $ | 3,098 | $ | 7,270 | |||||||||||||||
| Comprehensive income | $ | 75,712 | $ | 27,734 | $ | 82,012 | $ | 20,734 | |||||||||||||||
| Net income attributable to common stockholders – basic and diluted | $ | 74,543 | $ | 29,631 | $ | 78,914 | $ | 13,464 | |||||||||||||||
| Net income per share attributable to common stockholders – basic | $ | 0.61 | $ | 0.24 | $ | 0.65 | $ | 0.11 | |||||||||||||||
| Net income per share attributable to common stockholders – diluted | $ | 0.57 | $ | 0.23 | $ | 0.61 | $ | 0.11 | |||||||||||||||
| Weighted average common shares outstanding – basic | 121,956,220 | 122,434,615 | 122,177,966 | 122,504,476 | |||||||||||||||||||
| Weighted average common shares outstanding – diluted | 129,703,126 | 127,675,613 | 129,002,208 | 127,495,177 | |||||||||||||||||||
Condensed Consolidated Balance Sheets
(Unaudited) (Amounts in thousands, except par value per share and share amounts)
| September 30, 2026 | December 31, 2025 | ||||||||||
| Assets | |||||||||||
| Current assets: | |||||||||||
| Cash and cash equivalents | $ | 407,173 | $ | 330,303 | |||||||
| Short-term investments | 3,043 | 24,692 | |||||||||
| Accounts receivable, net | 48,294 | 34,776 | |||||||||
| Unbilled receivables, net | 19,305 | 20,522 | |||||||||
| Funds receivable from payment partners | 158,772 | 155,455 | |||||||||
| Prepaid expenses and other current assets | 47,436 | 36,540 | |||||||||
| Total current assets | 684,023 | 602,288 | |||||||||
| Property and equipment, net | 29,089 | 22,125 | |||||||||
| Intangible assets, net | 177,229 | 189,050 | |||||||||
| Goodwill | 407,646 | 406,507 | |||||||||
| Other assets | 72,326 | 33,343 | |||||||||
| Total assets | $ | 1,370,313 | $ | 1,253,313 | |||||||
| Liabilities and Stockholders’ Equity | |||||||||||
| Current liabilities: | |||||||||||
| Accounts payable | $ | 21,420 | $ | 15,298 | |||||||
| Funds payable to clients | 334,974 | 310,799 | |||||||||
| Accrued expenses and other current liabilities | 67,788 | 55,715 | |||||||||
| Deferred revenue | 23,100 | 19,951 | |||||||||
| Total current liabilities | 447,282 | 401,763 | |||||||||
| Deferred tax liabilities | 11,015 | 12,900 | |||||||||
| Other liabilities | 2,618 | 3,479 | |||||||||
| Total liabilities | 460,915 | 418,142 | |||||||||
| Commitments and contingencies | |||||||||||
| Stockholders’ equity: | |||||||||||
Preferred stock, $0.0001 par value; 10,000,000 shares authorized, none issued and outstanding as of September 30, 2026 and December 31, 2025 | — | — | |||||||||
Voting common stock, $0.0001 par value; 2,000,000,000 shares authorized, 134,837,558 shares issued and 122,494,955 shares outstanding as of September 30, 2026; 130,335,519 shares issued and 120,086,090 shares outstanding as of December 31, 2025 | 13 | 13 | |||||||||
Non-voting common stock, $0.0001 par value; 10,000,000 shares authorized, none issued and outstanding as of September 30, 2026, and 1,873,320 shares issued and outstanding as of December 31, 2025, respectively | — | — | |||||||||
Treasury voting common stock, at cost; 12,342,603 and 10,249,429 shares as of September 30, 2026 and December 31, 2025, respectively | (147,828) | (118,636) | |||||||||
| Additional paid-in capital | 1,130,086 | 1,108,679 | |||||||||
| Accumulated other comprehensive income | 5,586 | 2,488 | |||||||||
| Accumulated deficit | (78,459) | (157,373) | |||||||||
| Total stockholders’ equity | 909,398 | 835,171 | |||||||||
| Total liabilities and stockholders’ equity | $ | 1,370,313 | $ | 1,253,313 | |||||||
Condensed Consolidated Statement of Cash Flows
(Unaudited) (Amounts in thousands)
| Nine Months Ended September 30, | |||||||||||
| 2026 | 2025 | ||||||||||
| Cash flows from operating activities: | |||||||||||
| Net income | $ | 78,914 | $ | 13,464 | |||||||
| Adjustments to reconcile net income to net cash provided by operating activities: | |||||||||||
| Unrealized gain from remeasurement of foreign currency | (4,802) | (10,458) | |||||||||
| Depreciation and amortization | 22,657 | 19,037 | |||||||||
| Stock-based compensation expense | 52,097 | 53,473 | |||||||||
| Amortization of deferred contract costs | 1,724 | 1,167 | |||||||||
| Change in fair value of contingent consideration | 1,794 | (1,223) | |||||||||
| Deferred tax benefit | (29,187) | (452) | |||||||||
| Change in provision for uncollectible accounts | 2,011 | 1,629 | |||||||||
| Amortization of debt issuance costs | 296 | 173 | |||||||||
| Net accretion of discounts and amortization of premiums on investments | (19) | (612) | |||||||||
| Changes in operating assets and liabilities, net of acquisitions: | |||||||||||
| Accounts receivable | (15,684) | (11,585) | |||||||||
| Unbilled receivables | 1,247 | 2,105 | |||||||||
| Funds receivable from payment partners | (1,542) | (42,686) | |||||||||
| Prepaid expenses, other current assets and other assets | (22,902) | (21,304) | |||||||||
| Funds payable to clients | 27,167 | 83,343 | |||||||||
| Accounts payable, accrued expenses and other current liabilities | 14,441 | 7,537 | |||||||||
| Contingent consideration | — | (74) | |||||||||
| Other liabilities | (948) | 2,542 | |||||||||
| Deferred revenue | 3,153 | (787) | |||||||||
| Net cash provided by operating activities | 130,417 | 95,289 | |||||||||
| Cash flows from investing activities: | |||||||||||
| Acquisitions of businesses, net of cash acquired | — | (324,921) | |||||||||
| Assets acquisition | (3,229) | — | |||||||||
| Purchase of short-term and long-term investments | — | (14,199) | |||||||||
| Proceeds from the maturity and sale of short-term and long-term investments | 21,401 | 154,725 | |||||||||
| Capitalization of internally developed software | (10,068) | (5,813) | |||||||||
| Purchases of property and equipment | (621) | (960) | |||||||||
| Net cash provided by (used in) investing activities | 7,483 | (191,168) | |||||||||
| Cash flows from financing activities: | |||||||||||
| Proceeds from issuance of revolving credit facility | — | 125,000 | |||||||||
| Payment of revolving credit facility | — | (110,000) | |||||||||
| Payment of debt issuance costs | — | (758) | |||||||||
| Contingent consideration paid for acquisitions | — | (4,139) | |||||||||
| Payments of tax withholdings for net settled equity awards | (7,485) | (3,257) | |||||||||
| Common stock repurchased including related costs | (30,523) | (64,319) | |||||||||
| Non-voting common stock repurchased and retired | (29,036) | — | |||||||||
| Proceeds from the issuance of stock under Employee Stock Purchase Plan | 1,592 | 2,527 | |||||||||
| Proceeds from exercise of stock options | 2,908 | 2,064 | |||||||||
| Deferred acquisition payment | (1,000) | (1,000) | |||||||||
| Net cash used in financing activities | (63,544) | (53,882) | |||||||||
| Effect of exchange rates changes on cash and cash equivalents | 2,514 | 9,433 | |||||||||
| Net change in cash and cash equivalents | 76,870 | (140,328) | |||||||||
| Cash and cash equivalents, beginning of period | 330,303 | 495,242 | |||||||||
| Cash and cash equivalents, end of period | $ | 407,173 | $ | 354,914 | |||||||
Reconciliation of Non-GAAP Financial Measures
(Unaudited) (Amounts in millions, except percentages)
All dollar amounts in the tables below are rounded and as a result, certain amounts may not recalculate using the rounded amounts provided.
Revenue Less Ancillary Services, Adjusted Gross Profit and Adjusted Gross Margin
| Three Months Ended September 30, | Nine Months Ended September 30, | |||||||||||||||||||||||||
| (dollars in millions) | 2026 | 2025 | 2026 | 2025 | ||||||||||||||||||||||
| Revenue | $ | 250.3 | $ | 200.1 | $ | 606.2 | $ | 465.5 | ||||||||||||||||||
| Adjusted to exclude gross up for: | ||||||||||||||||||||||||||
| Pass-through cost for printing and mailing | (3.9) | (4.6) | (11.8) | (13.3) | ||||||||||||||||||||||
| Marketing fees | (1.9) | (1.4) | (2.0) | (1.9) | ||||||||||||||||||||||
| Revenue Less Ancillary Services | $ | 244.5 | $ | 194.1 | $ | 592.3 | $ | 450.3 | ||||||||||||||||||
| Payment processing services costs | 94.0 | 72.3 | 246.2 | 176.8 | ||||||||||||||||||||||
| Hosting and amortization costs within technology and development expenses | 3.6 | 3.1 | 10.9 | 8.3 | ||||||||||||||||||||||
| Cost of Revenue | $ | 97.6 | $ | 75.4 | $ | 257.1 | $ | 185.1 | ||||||||||||||||||
| Adjusted to: | ||||||||||||||||||||||||||
| Exclude printing and mailing costs | (3.9) | (4.6) | (11.8) | (13.3) | ||||||||||||||||||||||
| Offset marketing fees against related costs | (1.9) | (1.4) | (2.0) | (1.9) | ||||||||||||||||||||||
| Exclude depreciation and amortization | (3.1) | (2.8) | (10.0) | (7.5) | ||||||||||||||||||||||
| Adjusted Cost of Revenue | $ | 88.7 | $ | 66.6 | $ | 233.2 | $ | 162.4 | ||||||||||||||||||
| Gross Profit | $ | 152.7 | $ | 124.7 | $ | 349.1 | $ | 280.4 | ||||||||||||||||||
| Gross Margin | 61.0 | % | 62.3 | % | 57.6 | % | 60.2 | % | ||||||||||||||||||
| Adjusted Gross Profit | $ | 155.8 | $ | 127.5 | $ | 359.1 | $ | 287.9 | ||||||||||||||||||
| Adjusted Gross Margin | 63.7 | % | 65.7 | % | 60.6 | % | 63.9 | % | ||||||||||||||||||
Revenue Less Ancillary Services Disaggregated by Revenue Type
| Three Months Ended September 30, 2026 | Three Months Ended September 30, 2025 | |||||||||||||||||||||||||||||||||||||
| (dollars in millions) | Transaction | Platform and other revenues | Revenue | Transaction | Platform and other revenues | Revenue | ||||||||||||||||||||||||||||||||
| Revenue | $ | 215.1 | $ | 35.2 | $ | 250.3 | $ | 167.2 | $ | 33.0 | $ | 200.1 | ||||||||||||||||||||||||||
| Adjusted to exclude gross up for: | ||||||||||||||||||||||||||||||||||||||
| Pass-through cost for printing and mailing | — | (3.9) | (3.9) | — | (4.6) | (4.6) | ||||||||||||||||||||||||||||||||
| Marketing fees | (1.9) | — | (1.9) | (1.4) | — | (1.4) | ||||||||||||||||||||||||||||||||
| Revenue Less Ancillary Services | $ | 213.2 | $ | 31.3 | $ | 244.5 | $ | 165.7 | $ | 28.4 | $ | 194.1 | ||||||||||||||||||||||||||
| Percentage of Revenue | 85.9 | % | 14.1 | % | 100.0 | % | 83.5 | % | 16.5 | % | 100.0 | % | ||||||||||||||||||||||||||
| Percentage of Revenue Less Ancillary Services | 87.2 | % | 12.8 | % | 100.0 | % | 85.4 | % | 14.6 | % | 100.0 | % | ||||||||||||||||||||||||||
| Nine Months Ended September 30, 2026 | Nine Months Ended September 30, 2025 | |||||||||||||||||||||||||||||||||||||
| (dollars in millions) | Transaction | Platform and other revenues | Revenue | Transaction | Platform and other revenues | Revenue | ||||||||||||||||||||||||||||||||
| Revenue | $ | 506.2 | $ | 99.9 | $ | 606.2 | $ | 376.2 | $ | 89.2 | $ | 465.5 | ||||||||||||||||||||||||||
| Adjusted to exclude gross up for: | ||||||||||||||||||||||||||||||||||||||
| Pass-through cost for printing and mailing | — | (11.8) | (11.8) | — | (13.3) | (13.3) | ||||||||||||||||||||||||||||||||
| Marketing fees | (2.0) | — | (2.0) | (1.9) | — | (1.9) | ||||||||||||||||||||||||||||||||
| Revenue Less Ancillary Services | $ | 504.2 | $ | 88.1 | $ | 592.3 | $ | 374.3 | $ | 76.0 | $ | 450.3 | ||||||||||||||||||||||||||
| Percentage of Revenue | 83.5 | % | 16.5 | % | 100.0 | % | 80.8 | % | 19.2 | % | 100.0 | % | ||||||||||||||||||||||||||
| Percentage of Revenue Less Ancillary Services | 85.1 | % | 14.9 | % | 100.0 | % | 83.1 | % | 16.9 | % | 100.0 | % | ||||||||||||||||||||||||||
FX Neutral Revenue Less Ancillary Services
| Three Months Ended September 30, | Growth | Nine Months Ended September 30, | Growth | |||||||||||||||||||||||||||||||||||
| (dollars in millions) | 2026 | 2025 | Rate | 2026 | 2025 | Rate | ||||||||||||||||||||||||||||||||
| Revenue | $ | 250.3 | $ | 200.1 | 25.1 | % | $ | 606.2 | $ | 465.5 | 30.2 | % | ||||||||||||||||||||||||||
| Ancillary services | (5.8) | (6.0) | (13.8) | (15.2) | ||||||||||||||||||||||||||||||||||
| Revenue Less Ancillary Services | 244.5 | 194.1 | 26.0 | % | 592.3 | 450.3 | 31.5 | % | ||||||||||||||||||||||||||||||
| Effects of foreign currency rate fluctuations | 0.1 | — | (9.3) | — | ||||||||||||||||||||||||||||||||||
| FX Neutral Revenue Less Ancillary Services | $ | 244.6 | $ | 194.1 | 26.0 | % | $ | 583.0 | $ | 450.3 | 29.5 | % | ||||||||||||||||||||||||||
Reconciliation of GAAP Operating Expenses to Non-GAAP Operating Expenses
| Three Months Ended September 30, | Nine Months Ended September 30, | |||||||||||||||||||||||||
| (dollars in millions) | 2026 | 2025 | 2026 | 2025 | ||||||||||||||||||||||
| GAAP Technology and development | $ | 16.7 | $ | 17.7 | $ | 54.5 | $ | 51.7 | ||||||||||||||||||
| (-) Stock-based compensation expense and related taxes | (2.3) | (3.5) | (8.1) | (9.8) | ||||||||||||||||||||||
| (-) Depreciation and amortization | (1.7) | (1.7) | (5.1) | (4.9) | ||||||||||||||||||||||
| Non-GAAP Technology and development | $ | 12.7 | $ | 12.5 | $ | 41.3 | $ | 36.9 | ||||||||||||||||||
| GAAP Selling and marketing | $ | 42.6 | $ | 41.9 | $ | 122.0 | $ | 116.9 | ||||||||||||||||||
| (-) Stock-based compensation expense and related taxes | (6.0) | (5.2) | (17.0) | (14.5) | ||||||||||||||||||||||
| (-) Depreciation and amortization | (4.7) | (4.4) | (14.7) | (11.9) | ||||||||||||||||||||||
| Non-GAAP Selling and marketing | $ | 31.9 | $ | 32.3 | $ | 90.3 | $ | 90.5 | ||||||||||||||||||
| GAAP General and administrative | $ | 44.3 | $ | 36.0 | $ | 122.7 | $ | 99.2 | ||||||||||||||||||
| (-) Stock-based compensation expense and related taxes | (9.3) | (9.1) | (27.9) | (26.7) | ||||||||||||||||||||||
| (-) Depreciation and amortization | (1.0) | (0.7) | (3.0) | (2.1) | ||||||||||||||||||||||
| (-) Change in fair value of contingent consideration | (0.1) | 0.7 | (1.8) | 1.2 | ||||||||||||||||||||||
| (-) Acquisition related transaction costs | — | — | — | (2.6) | ||||||||||||||||||||||
| Non-GAAP General and administrative | $ | 34.0 | $ | 27.0 | $ | 90.0 | $ | 69.1 | ||||||||||||||||||
EBITDA, Adjusted EBITDA, and Adjusted EBITDA Margin
| Three Months Ended September 30, | Nine Months Ended September 30, | |||||||||||||||||||||||||
| (dollars in millions) | 2026 | 2025 | 2026 | 2025 | ||||||||||||||||||||||
| Net income | $ | 74.5 | $ | 29.6 | $ | 78.9 | $ | 13.5 | ||||||||||||||||||
| Interest expense | 0.5 | 1.2 | 1.1 | 3.0 | ||||||||||||||||||||||
| Interest income | (0.5) | (0.8) | (2.1) | (4.8) | ||||||||||||||||||||||
| (Benefit from) provision for income taxes | (22.2) | 1.6 | (17.2) | 7.7 | ||||||||||||||||||||||
| Depreciation and amortization expense | 8.0 | 7.2 | 24.5 | 20.2 | ||||||||||||||||||||||
| EBITDA | 60.3 | 38.8 | 85.2 | 39.5 | ||||||||||||||||||||||
| Stock-based compensation expense and related taxes | 17.5 | 17.8 | 53.0 | 51.0 | ||||||||||||||||||||||
| Change in fair value of contingent consideration | 0.1 | (0.7) | 1.8 | (1.2) | ||||||||||||||||||||||
| Loss (gain) from remeasurement of foreign currency | 0.5 | 0.6 | — | (6.9) | ||||||||||||||||||||||
| Gain on available-for-sale debt securities | — | — | — | (0.2) | ||||||||||||||||||||||
| Indirect taxes related to intercompany activity | 1.2 | 0.6 | 2.7 | 1.6 | ||||||||||||||||||||||
| Acquisition-related transaction costs | — | — | — | 2.6 | ||||||||||||||||||||||
| Restructuring | — | — | — | 8.7 | ||||||||||||||||||||||
| Adjusted EBITDA | $ | 79.5 | $ | 57.1 | $ | 142.8 | $ | 95.1 | ||||||||||||||||||
| Adjusted EBITDA margin | 32.5 | % | 29.4 | % | 24.1 | % | 21.1 | % | ||||||||||||||||||

Q3 2026 Earnings Supplement November 3, 2026 Exhibit 99.2
Disclosures This presentation includes forward-looking statements within the meaning of the Private Securities Litigation Reform Act of 1995 and Section 21E of the Securities Exchange Act of 1934, as amended. All statements other than statements of historical facts contained in this presentation, including statements regarding the outcome of the operational and portfolio reviews, the costs, cash outlays, benefits, timing and financial impacts of the actions that may be taken or transactions entered into in connection with the operational and portfolio reviews, Flywire’s ability to successfully implement Flywire’s business plan, future results of operations and financial position, business strategy and plans, market growth and Flywire’s objectives for future operations, are forward -looking statements. The words “believe,” “may,” “will,” “estimate,” “continue,” “anticipate,” “intend,” “expect,” “plans,” “potential,” “seeks,” “projects,” “should,” “could” and “would” and similar expressions are intended to identify forward -looking statements, although not all forward-looking statements contain these identifying words. Flywire has based these forward-looking statements largely on Flywire’s current expectations and projections about future events and financial trends that Flywire believes may affect Flywire’s financial condition, results of operations, business strategy, short-term and long-term business operations and objectives, and financial needs. These forward-looking statements are subject to a number of risks, uncertainties and assumptions that are described in the "Risk Factors" and "Management's Discussion and Analysis of Financial Condition and Results of Operations" sections of Flywire's Annual Report on Form 10-K for the year ended December 31, 2025 and Quarterly Report on Form 10-Q for the quarter ended June 30, 2026, which are on file with the Securities and Exchange Commission (SEC) and available on the SEC’s website at www.sec.gov. Additional factors may be described in those sections of Flywire’s Quarterly Report on Form 10-Q for the quarter ended September 30, 2026, expected to be filed with the SEC in the fourth quarter of 2026. In light of these risks, uncertainties and assumptions, the forward -looking events and circumstances discussed in this presentation may not occur and actual results could differ materially and adversely from those anticipated or implied in the forward-looking statements. You should not rely upon forward- looking statements as predictions of future events or performance. In addition, projections, assumptions and estimates of the future performance of the industries in which Flywire operates and the markets it serves are inherently imprecise and subject to a high degree of uncertainty and risk. All financial projections contained in this presentation are forward -looking statements and are based on Flywire’s management’s assessment of such matters. It is unlikely, however, that the assumptions on which Flywire has based its projections will prove to be fully correct or that the projected figures will be attained. Flywire’s actual future results may differ materially from Flywire’s projections, and it makes no express or implied representation or warranty as to attainability of the results reflected in these projections. Investments in Flywire’s securities involve a high degree of risk and should be regarded as speculative. The information in this presentation is provided only as of November 3, 2026, and Flywire undertakes no obligation to update any forward-looking statements contained in this presentation on account of new information, future events, or otherwise, except as required by law. This presentation contains certain non-GAAP financial measures as defined by SEC rules. Flywire has provided a reconciliation of those measures to the most directly comparable GAAP measures, which is available in the Appendix. The company has not provided a quantitative reconciliation of forecasted FX-Neutral Revenue Less Ancillary Services Growth to forecasted GAAP Revenue Growth or forecasted Adjusted EBITDA Margin Growth to forecasted GAAP Net Income Margin Growth or to forecasted GAAP net income (loss) before income taxes within this presentation because Flywire is unable, without making unreasonable efforts, to calculate certain reconciling items with confidence. These items include but are not limited to income taxes which are directly impacted by unpredictable fluctuations in the market price of the company's stock and in foreign exchange rates.
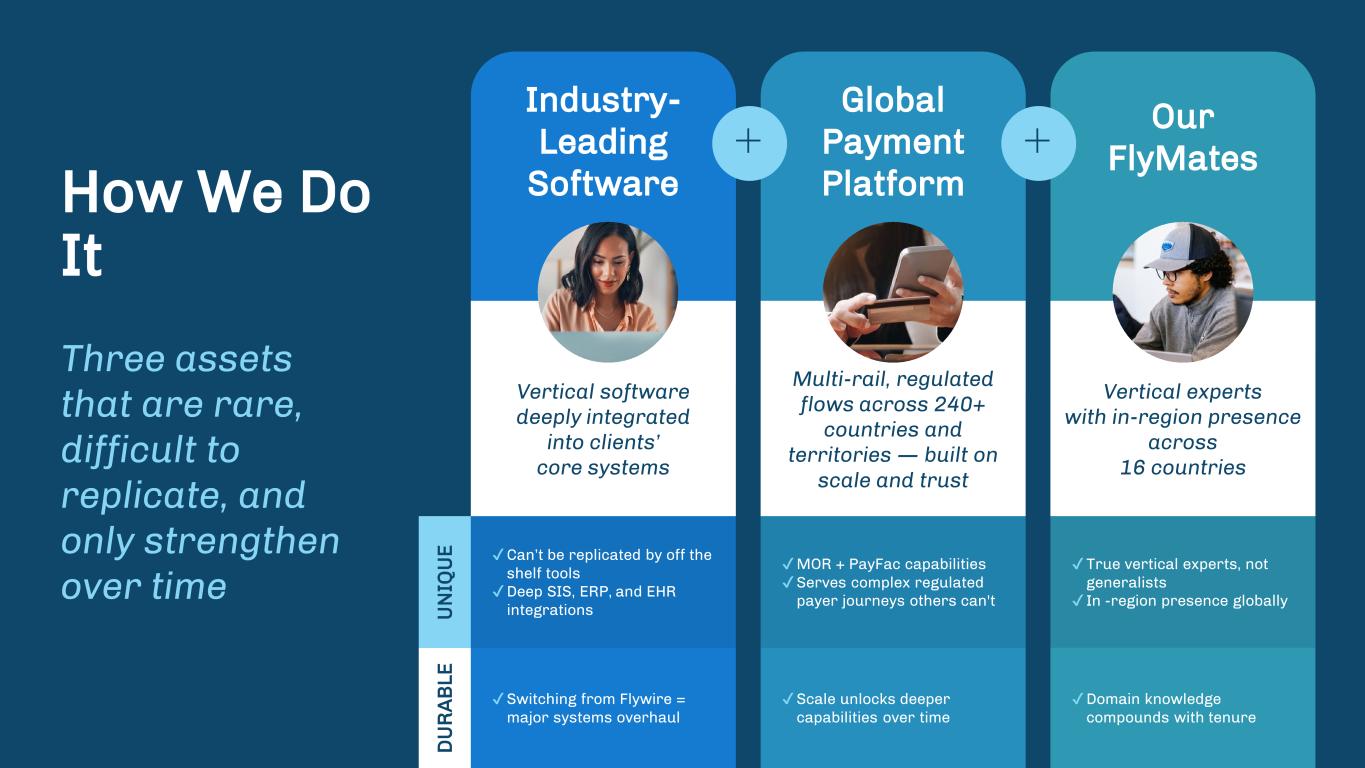
Our FlyMates Global Payment Platform Industry- Leading Software ✔Switching from Flywire = major systems overhaul ✔Scale unlocks deeper capabilities over time ✔Domain knowledge compounds with tenure Vertical software deeply integrated into clients’ core systems Vertical experts with in-region presence across 16 countries How We Do It Three assets that are rare, difficult to replicate, and only strengthen over time Multi-rail, regulated flows across 240+ countries and territories — built on scale and trust ✔Can’t be replicated by off the shelf tools ✔Deep SIS, ERP, and EHR integrations ✔MOR + PayFac capabilities ✔Serves complex regulated payer journeys others can't ✔True vertical experts, not generalists ✔ In -region presence globally + U N IQ U E D U R A B LE +
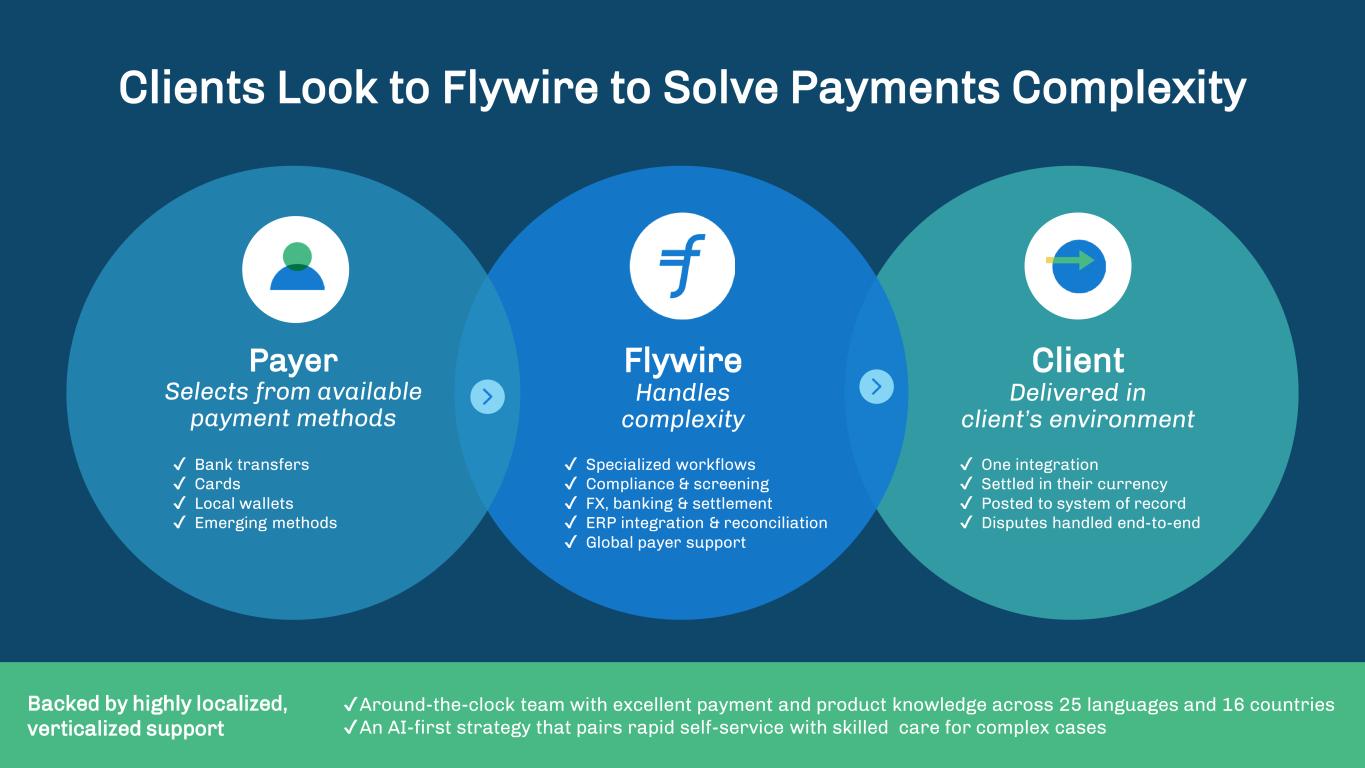
Backed by highly localized, verticalized support Clients Look to Flywire to Solve Payments Complexity Client Delivered in client’s environment ✔ One integration ✔ Settled in their currency ✔ Posted to system of record ✔ Disputes handled end-to-end ✔Around-the-clock team with excellent payment and product knowledge across 25 languages and 16 countries ✔An AI-first strategy that pairs rapid self-service with skilled care for complex cases Flywire Handles complexity ✔ Specialized workflows ✔ Compliance & screening ✔ FX, banking & settlement ✔ ERP integration & reconciliation ✔ Global payer support Payer Selects from available payment methods ✔ Bank transfers ✔ Cards ✔ Local wallets ✔ Emerging methods
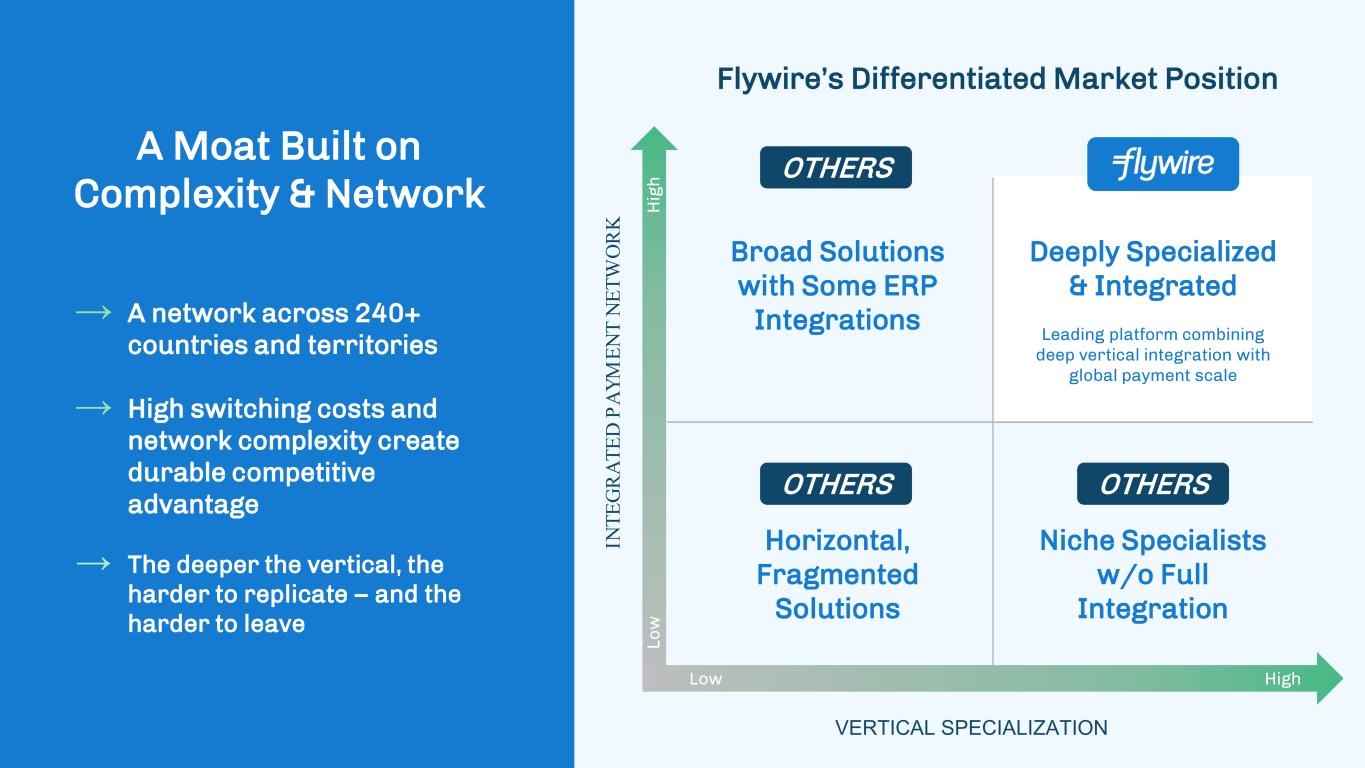
Broad Solutions with Some ERP Integrations A Moat Built on Complexity & Network → A network across 240+ countries and territories → High switching costs and network complexity create durable competitive advantage → The deeper the vertical, the harder to replicate – and the harder to leave VERTICAL SPECIALIZATION IN TE G R A TE D P A YM EN T N ET W O R K Lo w H ig h Horizontal, Fragmented Solutions Niche Specialists w/o Full Integration Flywire’s Differentiated Market Position Deeply Specialized & Integrated Low High OTHERS OTHERS OTHERS Leading platform combining deep vertical integration with global payment scale
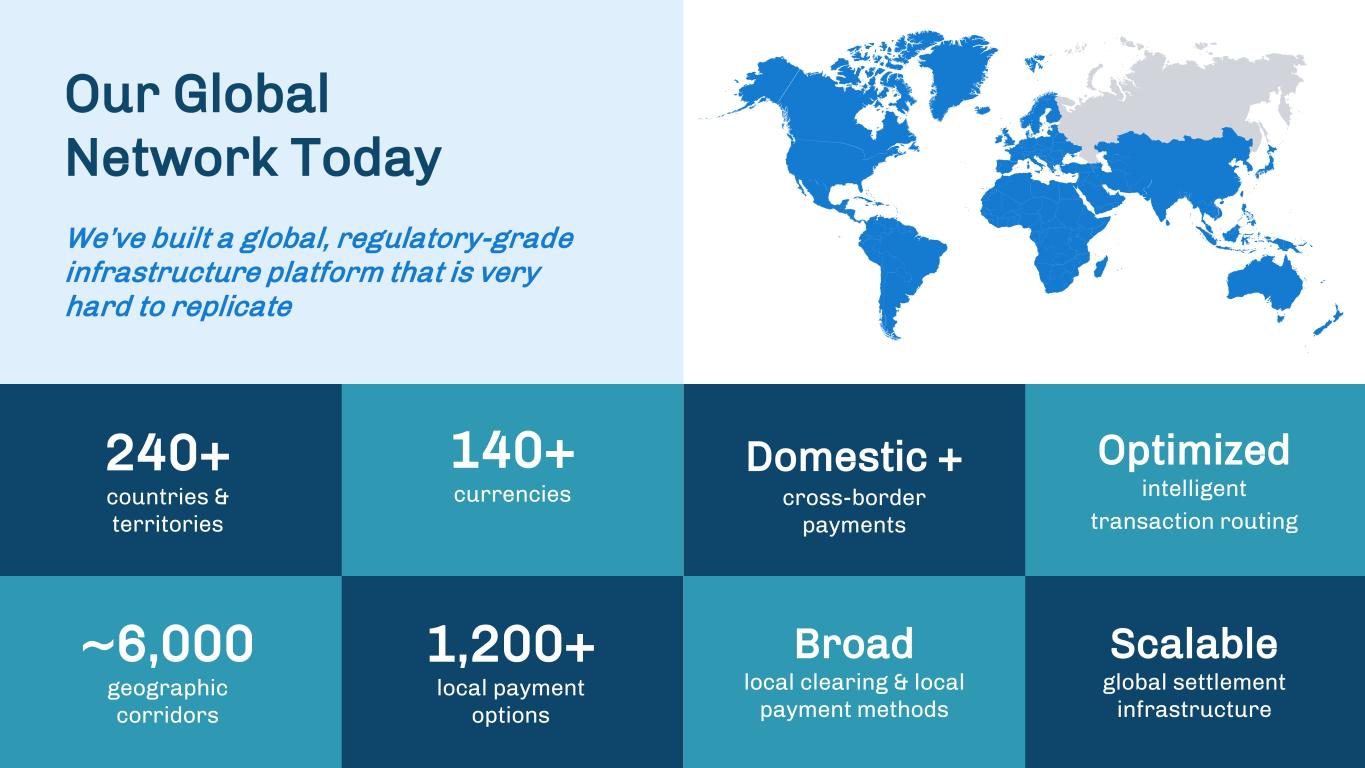
240+ countries & territories 1,200+ local payment options 140+ currencies Optimized intelligent transaction routing ~6,000 geographic corridors Domestic + cross-border payments Scalable global settlement infrastructure Broad local clearing & local payment methods Our Global Network Today We’ve built a global, regulatory-grade infrastructure platform that is very hard to replicate

US EDU Spotlight
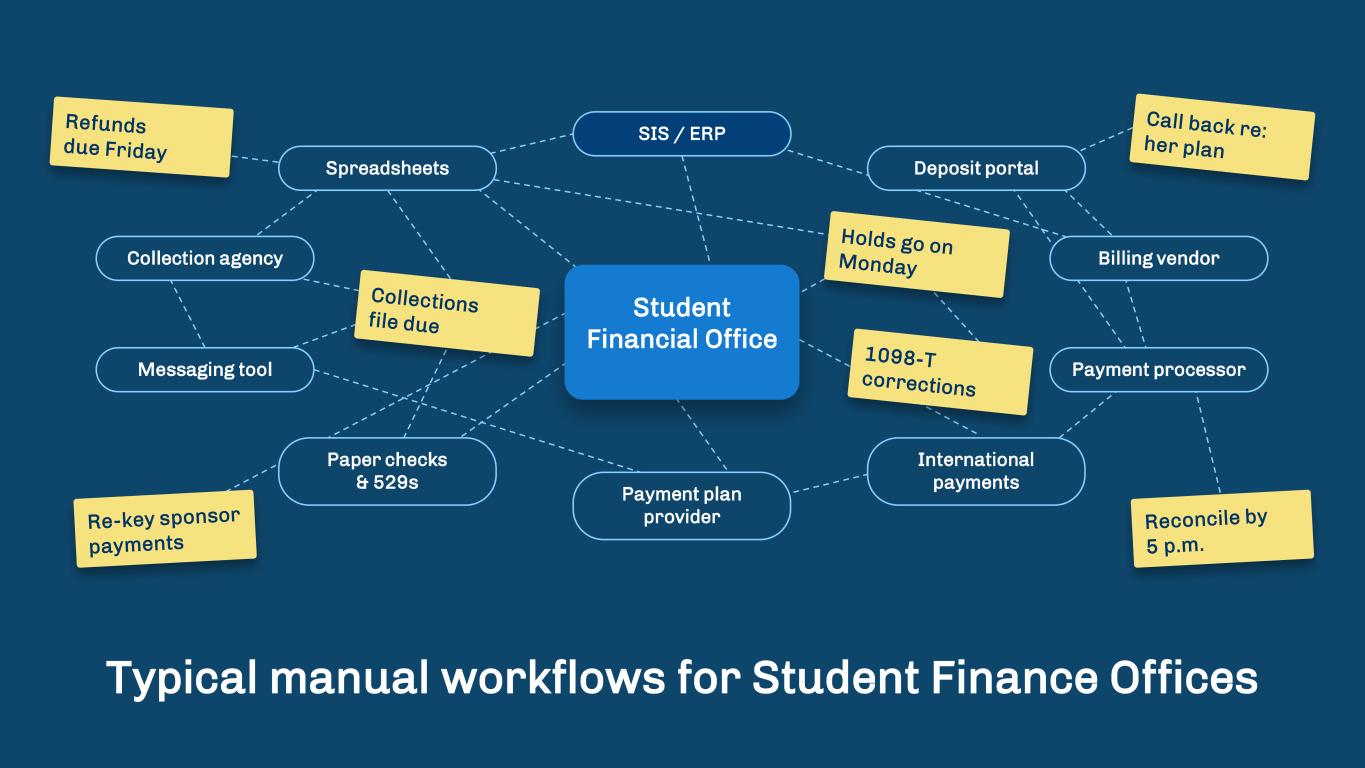
Typical manual workflows for Student Finance Offices SIS / ERP Payment processor International payments Payment plan provider Paper checks & 529s Messaging tool Collection agency Spreadsheets Student Financial Office Deposit portal Billing vendor
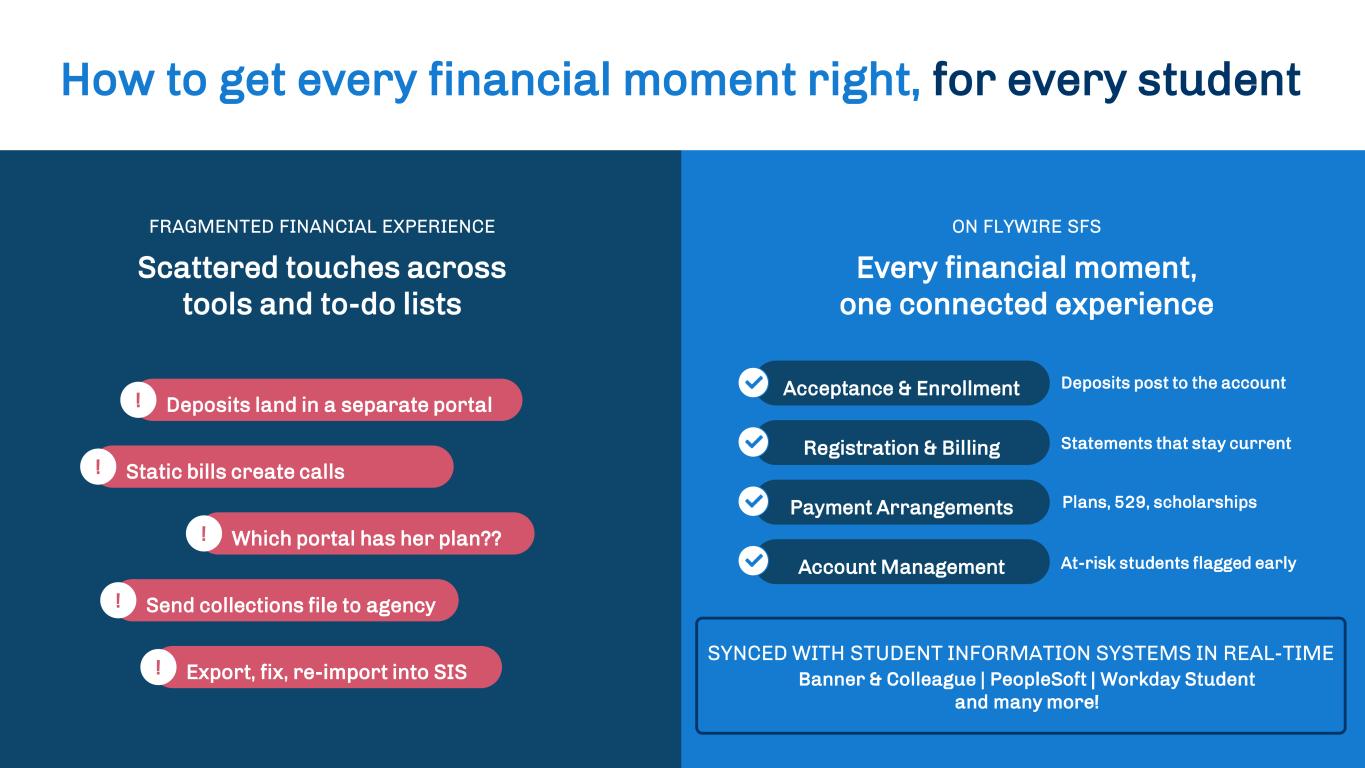
How to get every financial moment right, for every student FRAGMENTED FINANCIAL EXPERIENCE Scattered touches across tools and to-do lists Acceptance & Enrollment Deposits post to the account Registration & Billing Statements that stay current Payment Arrangements Plans, 529, scholarships Account Management At-risk students flagged early SYNCED WITH STUDENT INFORMATION SYSTEMS IN REAL-TIME Banner & Colleague | PeopleSoft | Workday Student and many more! ! Deposits land in a separate portal ! Static bills create calls ! Which portal has her plan?? ! Send collections file to agency ! Export, fix, re-import into SIS ON FLYWIRE SFS Every financial moment, one connected experience
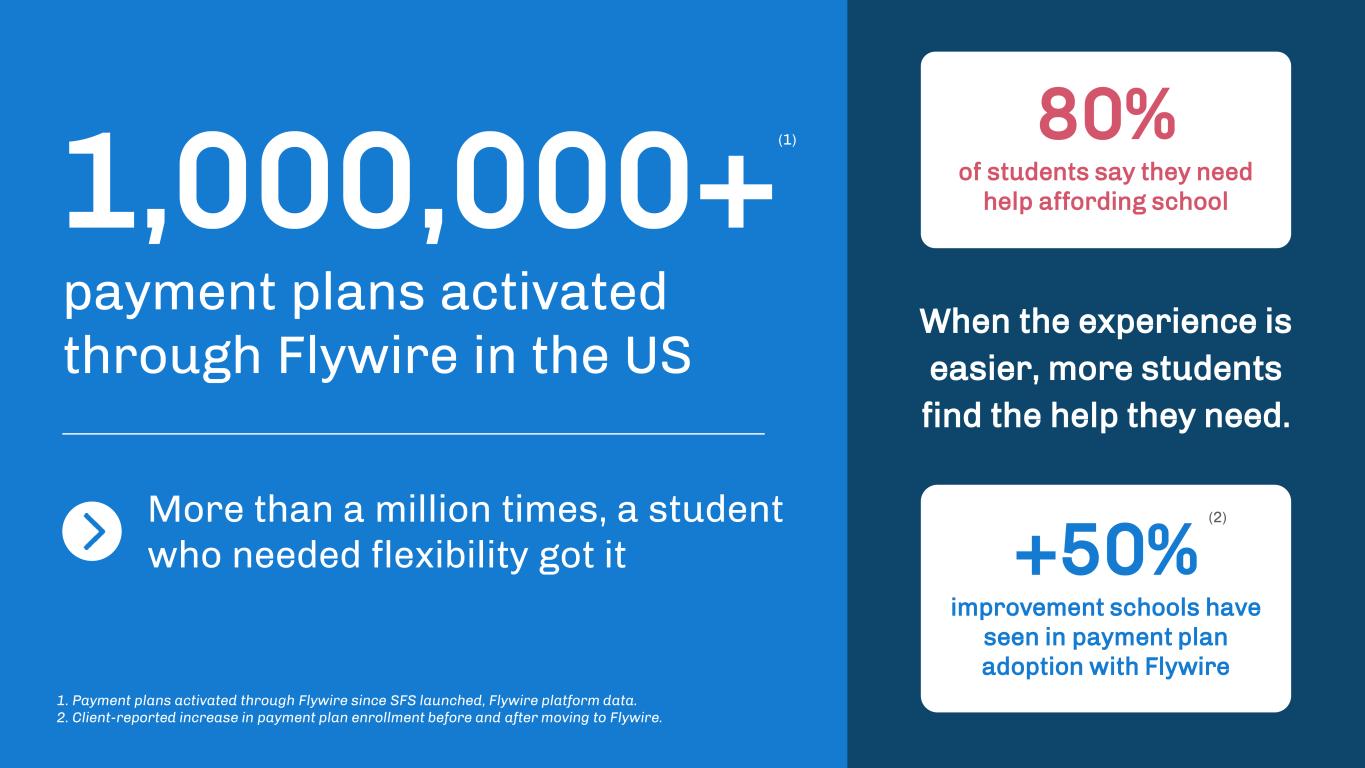
1,000,000+ payment plans activated through Flywire in the US When the experience is easier, more students find the help they need. +50% improvement schools have seen in payment plan adoption with Flywire 1. Payment plans activated through Flywire since SFS launched, Flywire platform data. 2. Client-reported increase in payment plan enrollment before and after moving to Flywire. More than a million times, a student who needed flexibility got it 80% of students say they need help affording school (1) (2)
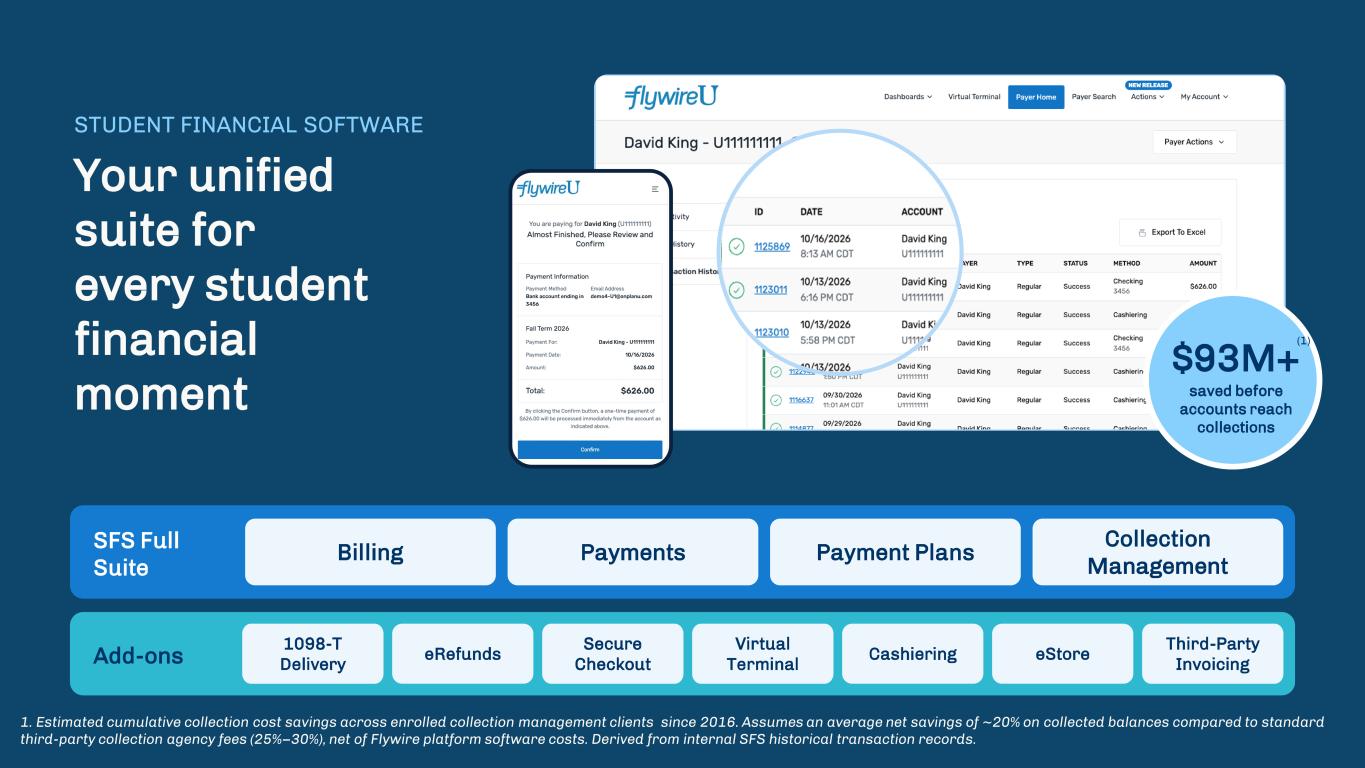
STUDENT FINANCIAL SOFTWARE Your unified suite for every student financial moment SFS Full Suite Billing Payments Payment Plans Collection Management Add-ons 1098-T Delivery eRefunds Secure Checkout Virtual Terminal Cashiering eStore Third-Party Invoicing Payer view $93M+ saved before accounts reach collections (1) 1. Estimated cumulative collection cost savings across enrolled collection management clients since 2016. Assumes an average net savings of ~20% on collected balances compared to standard third-party collection agency fees (25%–30%), net of Flywire platform software costs. Derived from internal SFS historical transaction records.

Collect directly to keep more students and more revenue DOING MORE WITH LESS Chasing past-due balances is costly and ineffective, and collections agencies are an expensive last resort. Collection Management automates the process and gives students flexibility to pay or get on a plan, and stay enrolled. Available now Analytics Dashboard Available now Standard plans
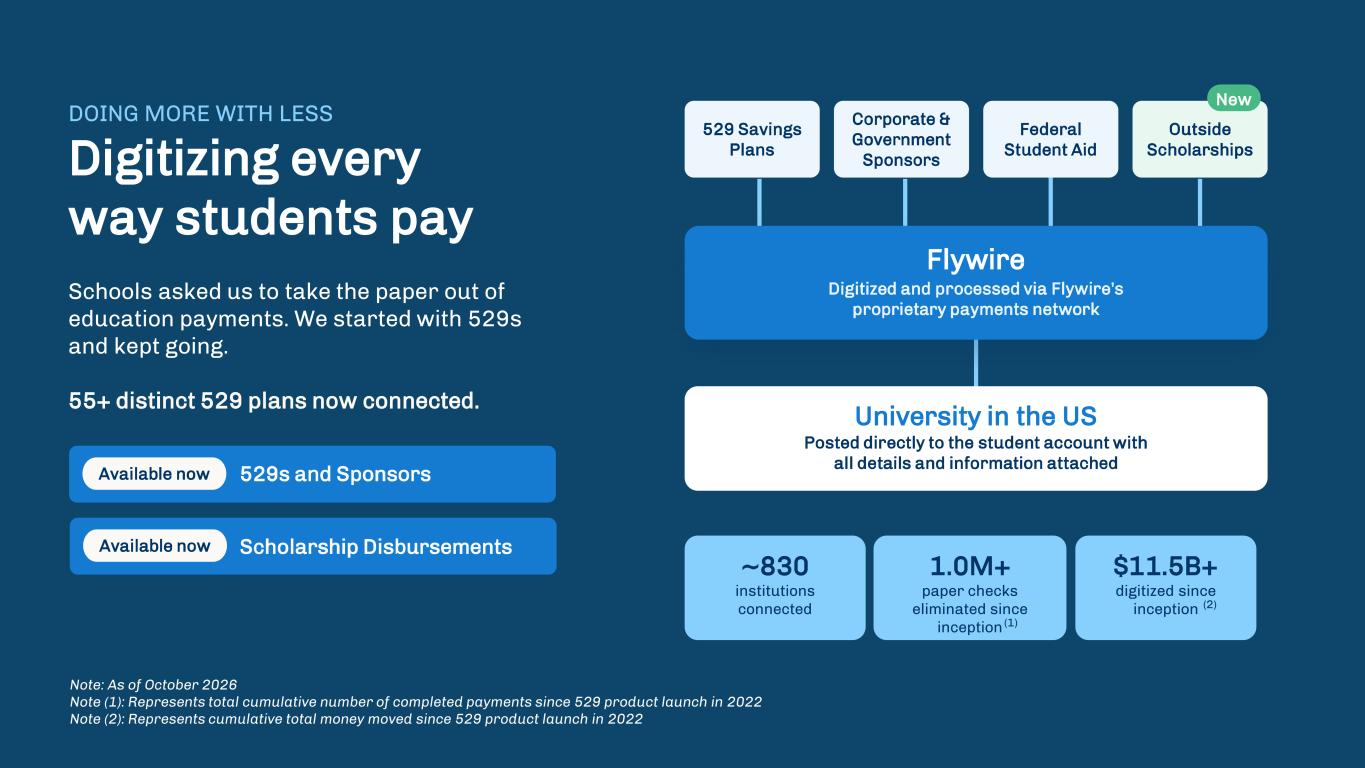
529 Savings Plans Corporate & Government Sponsors Federal Student Aid Outside Scholarships New University in the US Posted directly to the student account with all details and information attached DOING MORE WITH LESS Digitizing every way students pay Schools asked us to take the paper out of education payments. We started with 529s and kept going. 55+ distinct 529 plans now connected. Available now 529s and Sponsors Available now Scholarship Disbursements ~830 institutions connected 1.0M+ paper checks eliminated since inception $11.5B+ digitized since inception Note: As of October 2026 Note (1): Represents total cumulative number of completed payments since 529 product launch in 2022 Note (2): Represents cumulative total money moved since 529 product launch in 2022 (1) (2) Flywire Digitized and processed via Flywire’s proprietary payments network
Q3 2026 Performance
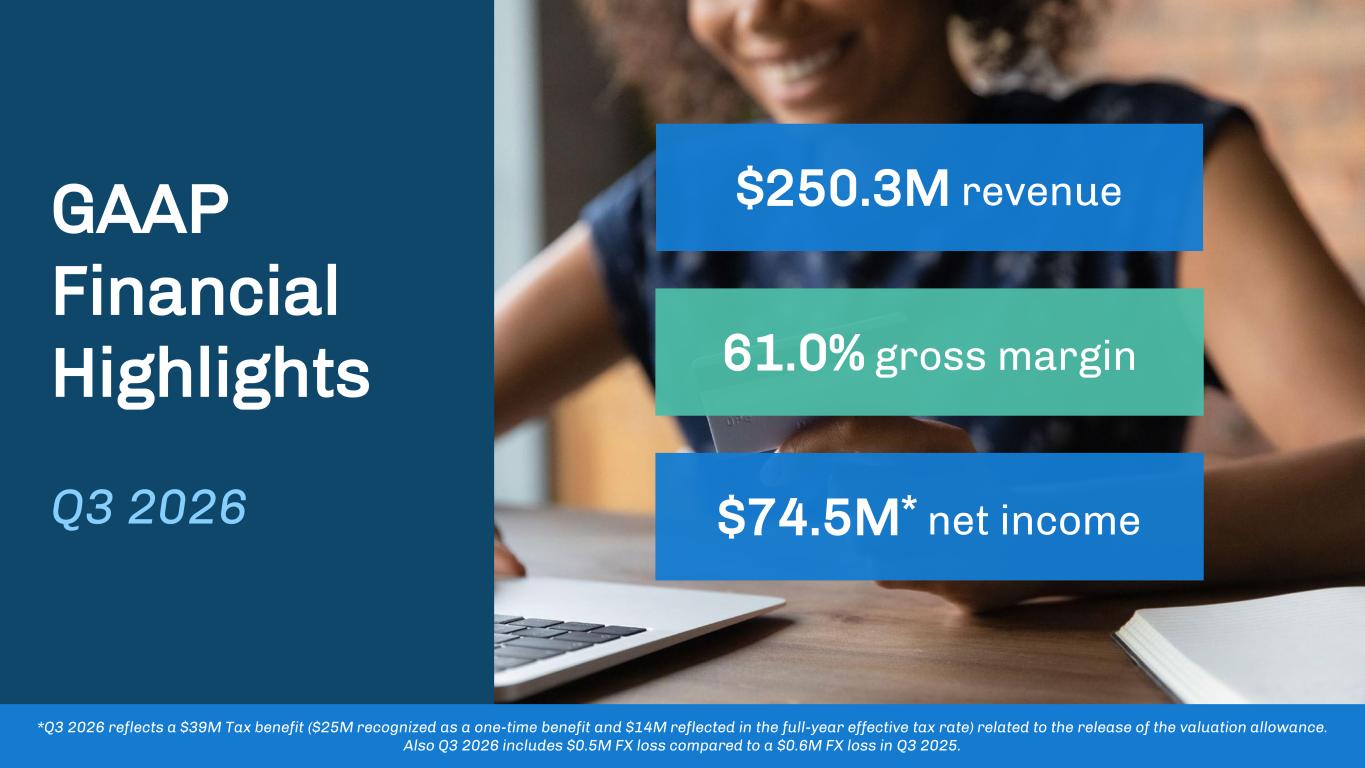
$250.3M revenue $74.5M* net income 61.0% gross margin *Q3 2026 reflects a $39M Tax benefit ($25M recognized as a one-time benefit and $14M reflected in the full-year effective tax rate) related to the release of the valuation allowance. Also Q3 2026 includes $0.5M FX loss compared to a $0.6M FX loss in Q3 2025. GAAP Financial Highlights Q3 2026
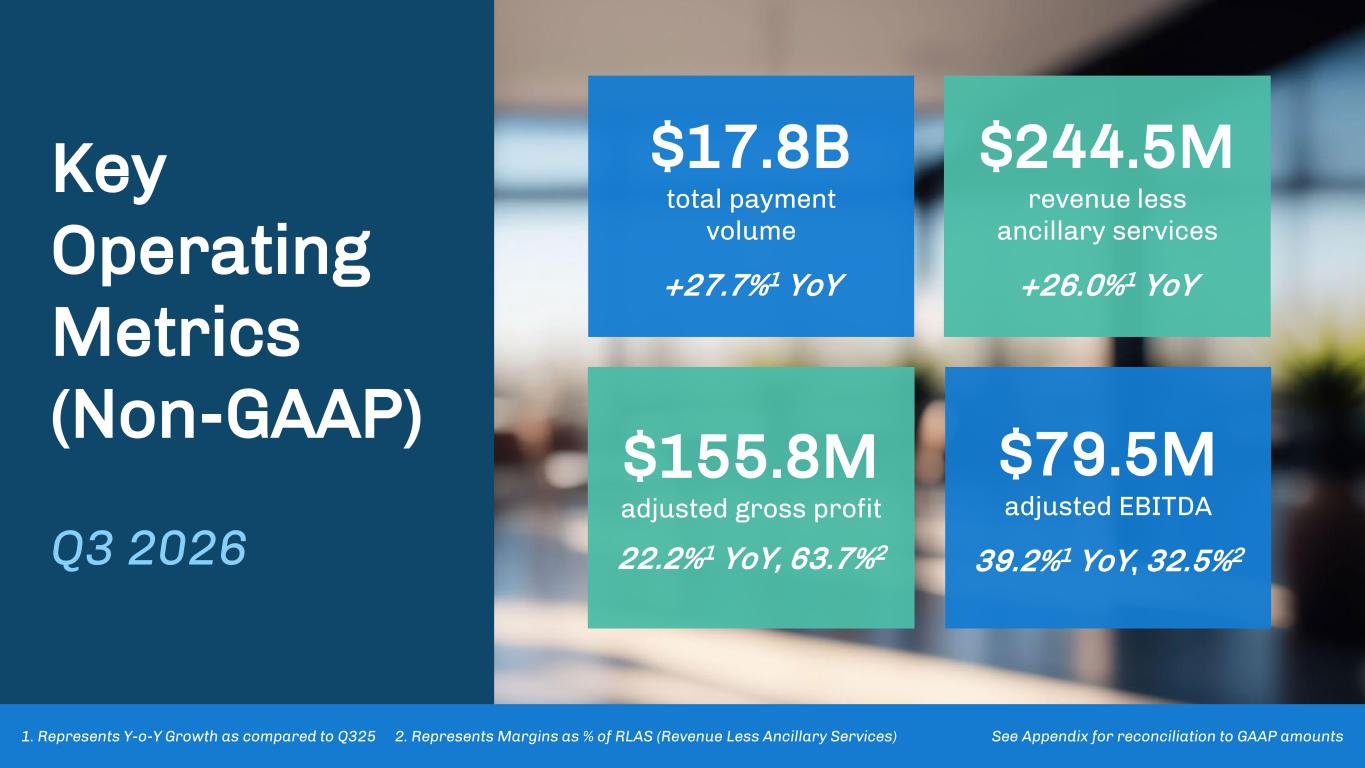
Key Operating Metrics (Non-GAAP) Q3 2026 $17.8B total payment volume +27.7%1 YoY $155.8M adjusted gross profit 22.2%1 YoY, 63.7%2 $79.5M adjusted EBITDA 39.2%1 YoY, 32.5%2 $244.5M revenue less ancillary services +26.0%1 YoY 1. Represents Y-o-Y Growth as compared to Q325 2. Represents Margins as % of RLAS (Revenue Less Ancillary Services) See Appendix for reconciliation to GAAP amounts
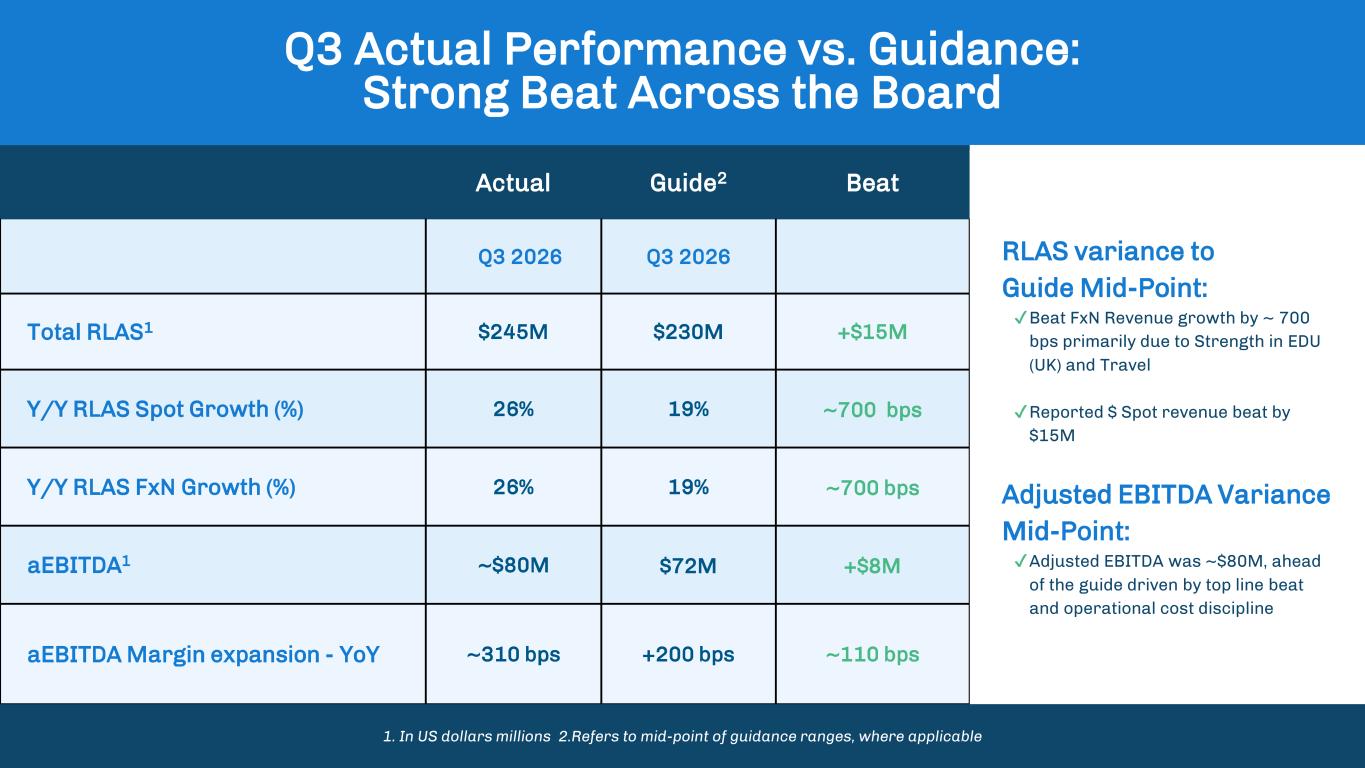
Q3 Actual Performance vs. Guidance: Strong Beat Across the Board Actual Guide2 Beat Q3 2026 Q3 2026 Total RLAS1 $245M $230M +$15M Y/Y RLAS Spot Growth (%) 26% 19% ~700 bps Y/Y RLAS FxN Growth (%) 26% 19% ~700 bps aEBITDA1 ~$80M $72M +$8M aEBITDA Margin expansion - YoY ~310 bps +200 bps ~110 bps RLAS variance to Guide Mid-Point: ✔Beat FxN Revenue growth by ~ 700 bps primarily due to Strength in EDU (UK) and Travel ✔Reported $ Spot revenue beat by $15M Adjusted EBITDA Variance Mid-Point: ✔Adjusted EBITDA was ~$80M, ahead of the guide driven by top line beat and operational cost discipline 1. In US dollars millions 2.Refers to mid-point of guidance ranges, where applicable
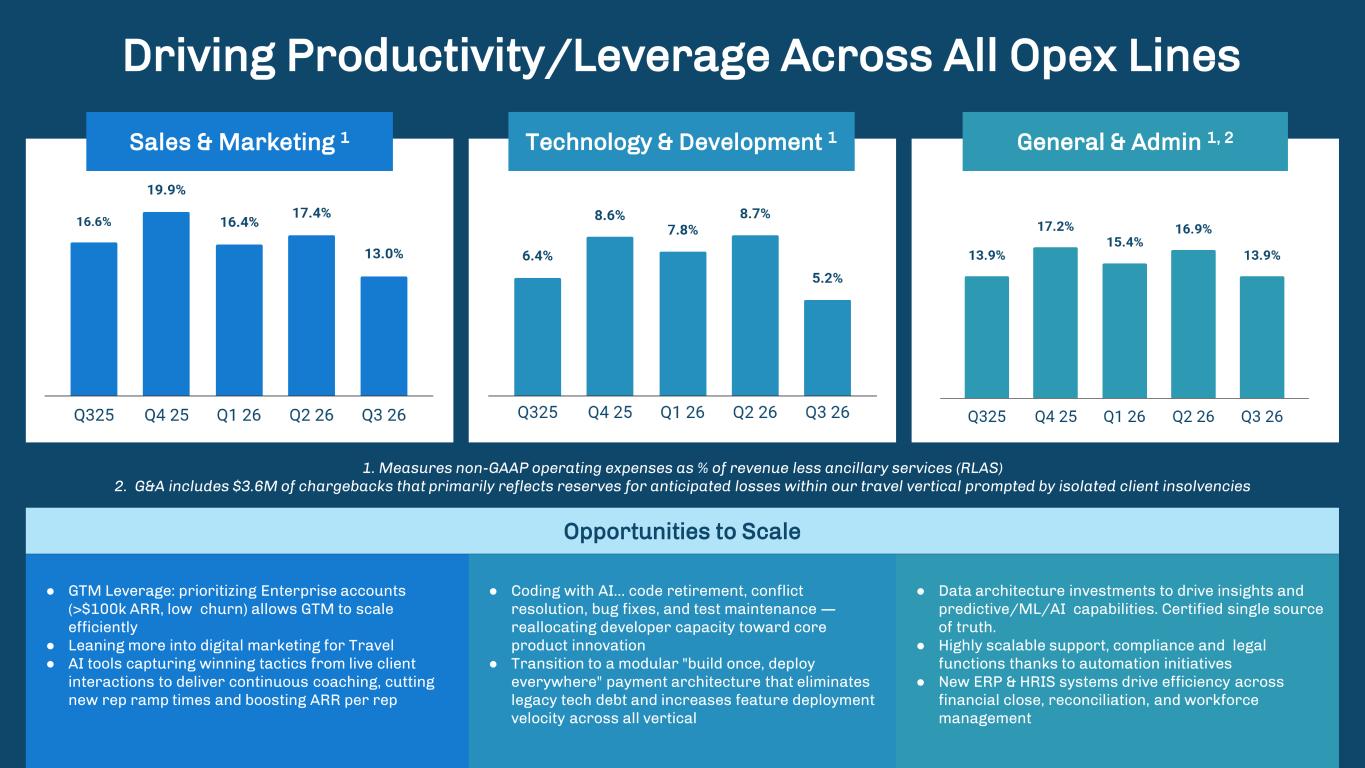
● Coding with AI… code retirement, conflict resolution, bug fixes, and test maintenance — reallocating developer capacity toward core product innovation ● Transition to a modular "build once, deploy everywhere" payment architecture that eliminates legacy tech debt and increases feature deployment velocity across all vertical ● Data architecture investments to drive insights and predictive/ML/AI capabilities. Certified single source of truth. ● Highly scalable support, compliance and legal functions thanks to automation initiatives ● New ERP & HRIS systems drive efficiency across financial close, reconciliation, and workforce management ● GTM Leverage: prioritizing Enterprise accounts (>$100k ARR, low churn) allows GTM to scale efficiently ● Leaning more into digital marketing for Travel ● AI tools capturing winning tactics from live client interactions to deliver continuous coaching, cutting new rep ramp times and boosting ARR per rep Driving Productivity/Leverage Across All Opex Lines Opportunities to Scale 1. Measures non-GAAP operating expenses as % of revenue less ancillary services (RLAS) 2. G&A includes $3.6M of chargebacks that primarily reflects reserves for anticipated losses within our travel vertical prompted by isolated client insolvencies Technology & Development 1 General & Admin 1, 2Sales & Marketing 1
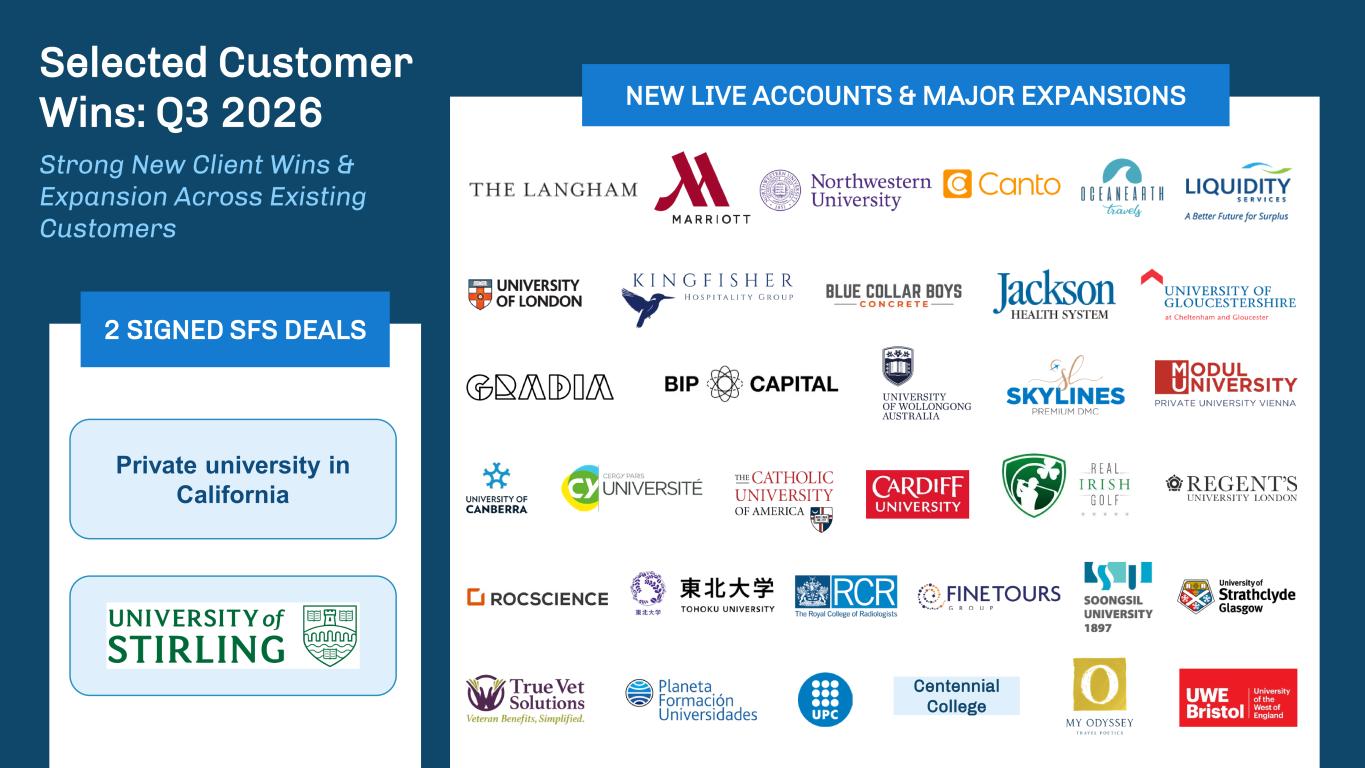
Selected Customer Wins: Q3 2026 Strong New Client Wins & Expansion Across Existing Customers 2 SIGNED SFS DEALS NEW LIVE ACCOUNTS & MAJOR EXPANSIONS Centennial College Private university in California

2026 & Q4 Financial Outlook
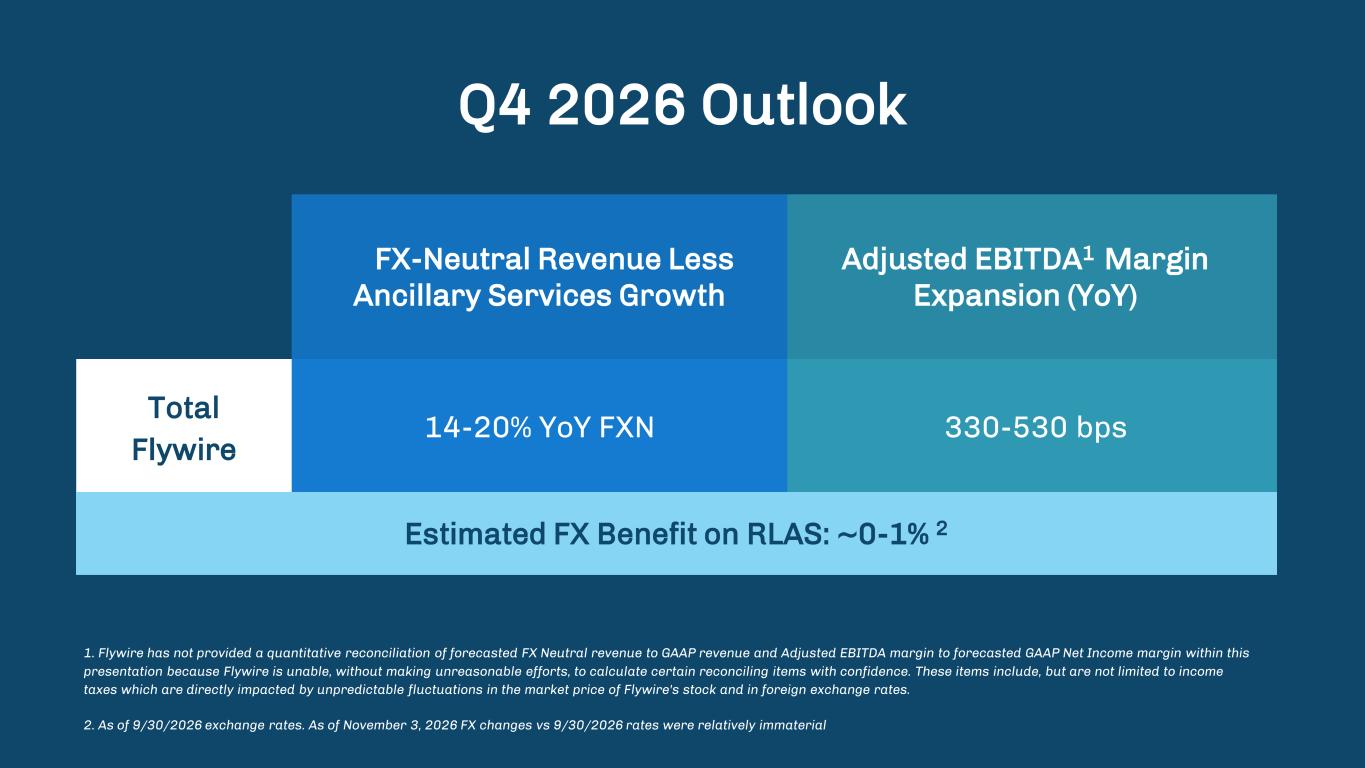
Q4 2026 Outlook 1. Flywire has not provided a quantitative reconciliation of forecasted FX Neutral revenue to GAAP revenue and Adjusted EBITDA margin to forecasted GAAP Net Income margin within this presentation because Flywire is unable, without making unreasonable efforts, to calculate certain reconciling items with confidence. These items include, but are not limited to income taxes which are directly impacted by unpredictable fluctuations in the market price of Flywire's stock and in foreign exchange rates. 2. As of 9/30/2026 exchange rates. As of November 3, 2026 FX changes vs 9/30/2026 rates were relatively immaterial FX-Neutral Revenue Less Ancillary Services Growth Adjusted EBITDA1 Margin Expansion (YoY) Total Flywire 14-20% YoY FXN 330-530 bps Estimated FX Benefit on RLAS: ~0-1% 2
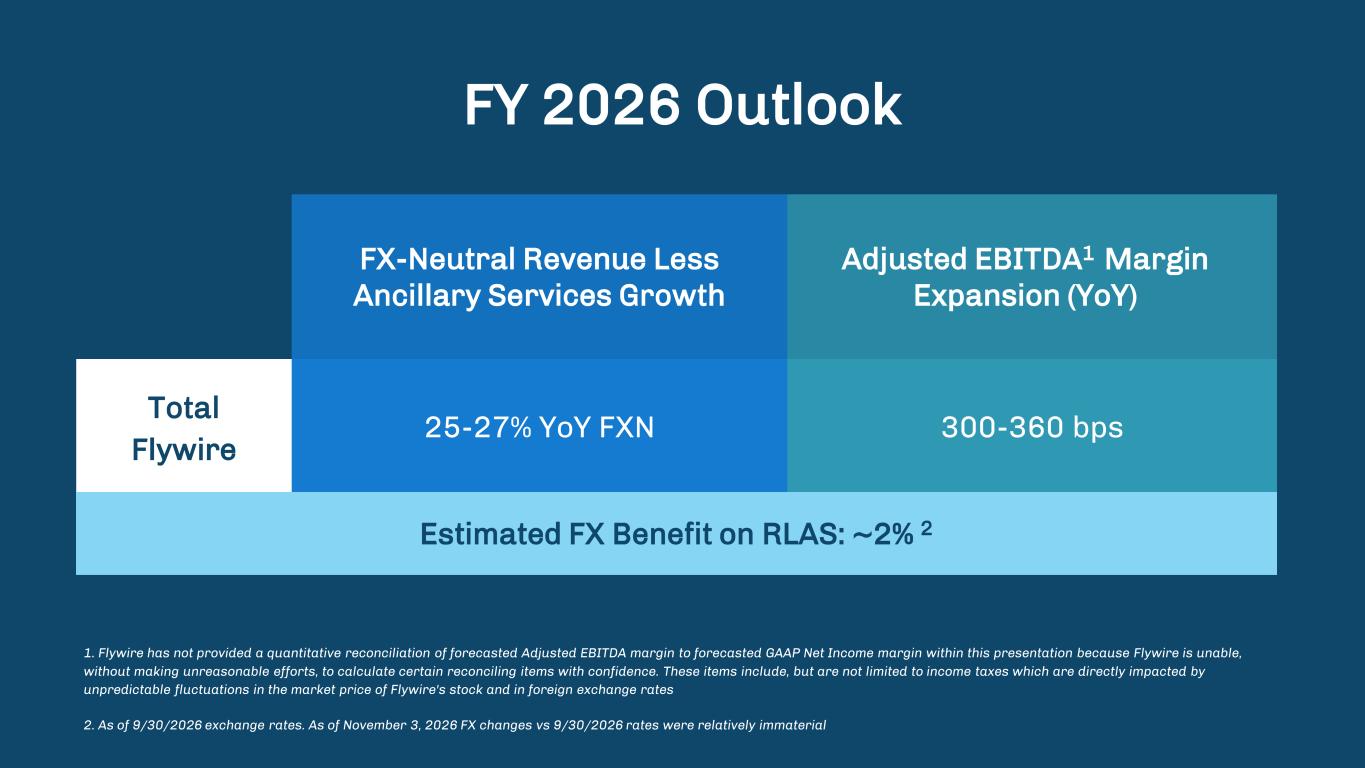
FY 2026 Outlook 1. Flywire has not provided a quantitative reconciliation of forecasted Adjusted EBITDA margin to forecasted GAAP Net Income margin within this presentation because Flywire is unable, without making unreasonable efforts, to calculate certain reconciling items with confidence. These items include, but are not limited to income taxes which are directly impacted by unpredictable fluctuations in the market price of Flywire's stock and in foreign exchange rates 2. As of 9/30/2026 exchange rates. As of November 3, 2026 FX changes vs 9/30/2026 rates were relatively immaterial FX-Neutral Revenue Less Ancillary Services Growth Adjusted EBITDA1 Margin Expansion (YoY) Total Flywire 25-27% YoY FXN 300-360 bps Estimated FX Benefit on RLAS: ~2% 2
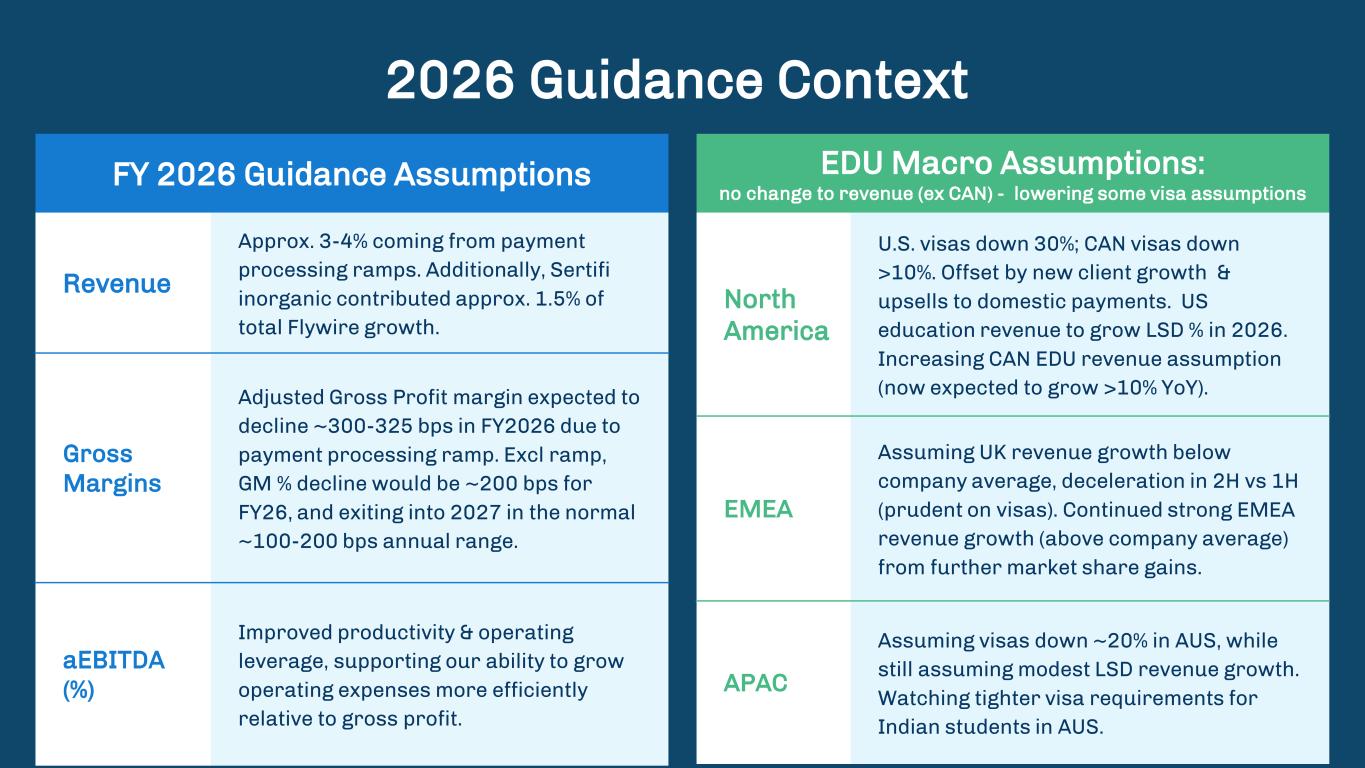
FY 2026 Guidance Assumptions EDU Macro Assumptions: no change to revenue (ex CAN) - lowering some visa assumptions Revenue Approx. 3-4% coming from payment processing ramps. Additionally, Sertifi inorganic contributed approx. 1.5% of total Flywire growth. Gross Margins Adjusted Gross Profit margin expected to decline ~300-325 bps in FY2026 due to payment processing ramp. Excl ramp, GM % decline would be ~200 bps for FY26, and exiting into 2027 in the normal ~100-200 bps annual range. aEBITDA (%) Improved productivity & operating leverage, supporting our ability to grow operating expenses more efficiently relative to gross profit. 2026 Guidance Context North America U.S. visas down 30%; CAN visas down >10%. Offset by new client growth & upsells to domestic payments. US education revenue to grow LSD % in 2026. Increasing CAN EDU revenue assumption (now expected to grow >10% YoY). EMEA Assuming UK revenue growth below company average, deceleration in 2H vs 1H (prudent on visas). Continued strong EMEA revenue growth (above company average) from further market share gains. APAC Assuming visas down ~20% in AUS, while still assuming modest LSD revenue growth. Watching tighter visa requirements for Indian students in AUS.

Capital Allocation & Structure
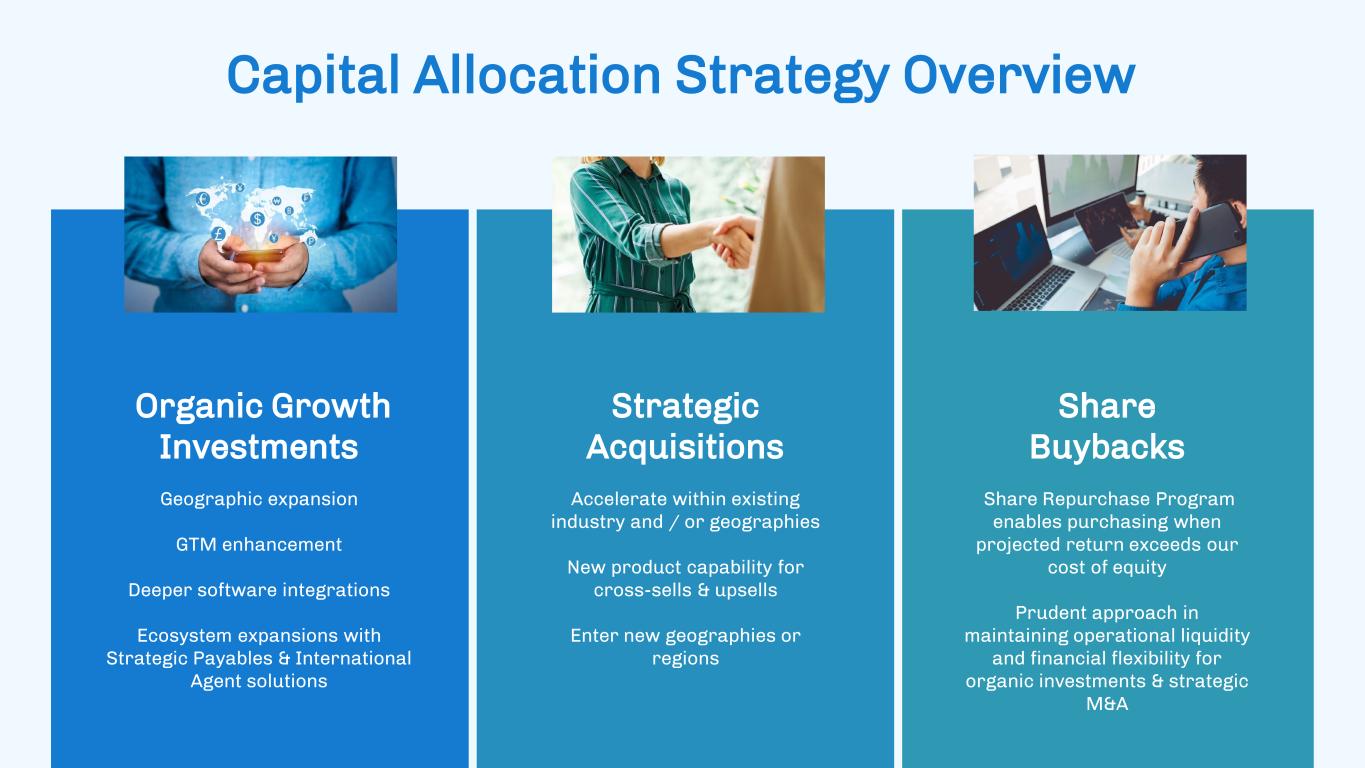
Capital Allocation Strategy Overview Organic Growth Investments Geographic expansion GTM enhancement Deeper software integrations Ecosystem expansions with Strategic Payables & International Agent solutions Strategic Acquisitions Accelerate within existing industry and / or geographies New product capability for cross-sells & upsells Enter new geographies or regions Share Buybacks Share Repurchase Program enables purchasing when projected return exceeds our cost of equity Prudent approach in maintaining operational liquidity and financial flexibility for organic investments & strategic M&A
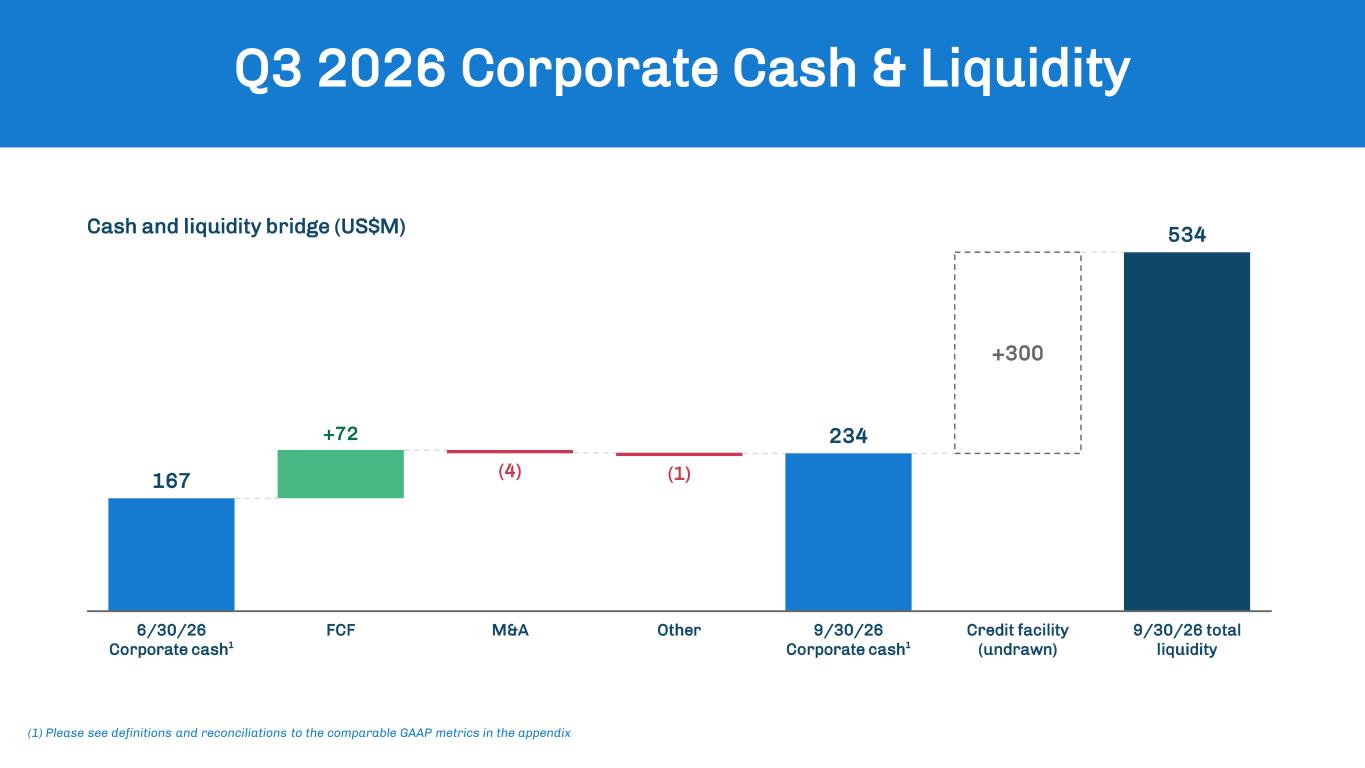
Q3 2026 Corporate Cash & Liquidity Cash and liquidity bridge (US$M) (1) Please see definitions and reconciliations to the comparable GAAP metrics in the appendix 167 6/30/26 Corporate cash¹ +72 FCF (4) M&A (1) Other 234 9/30/26 Corporate cash¹ +300 Credit facility (undrawn) 534 9/30/26 total liquidity
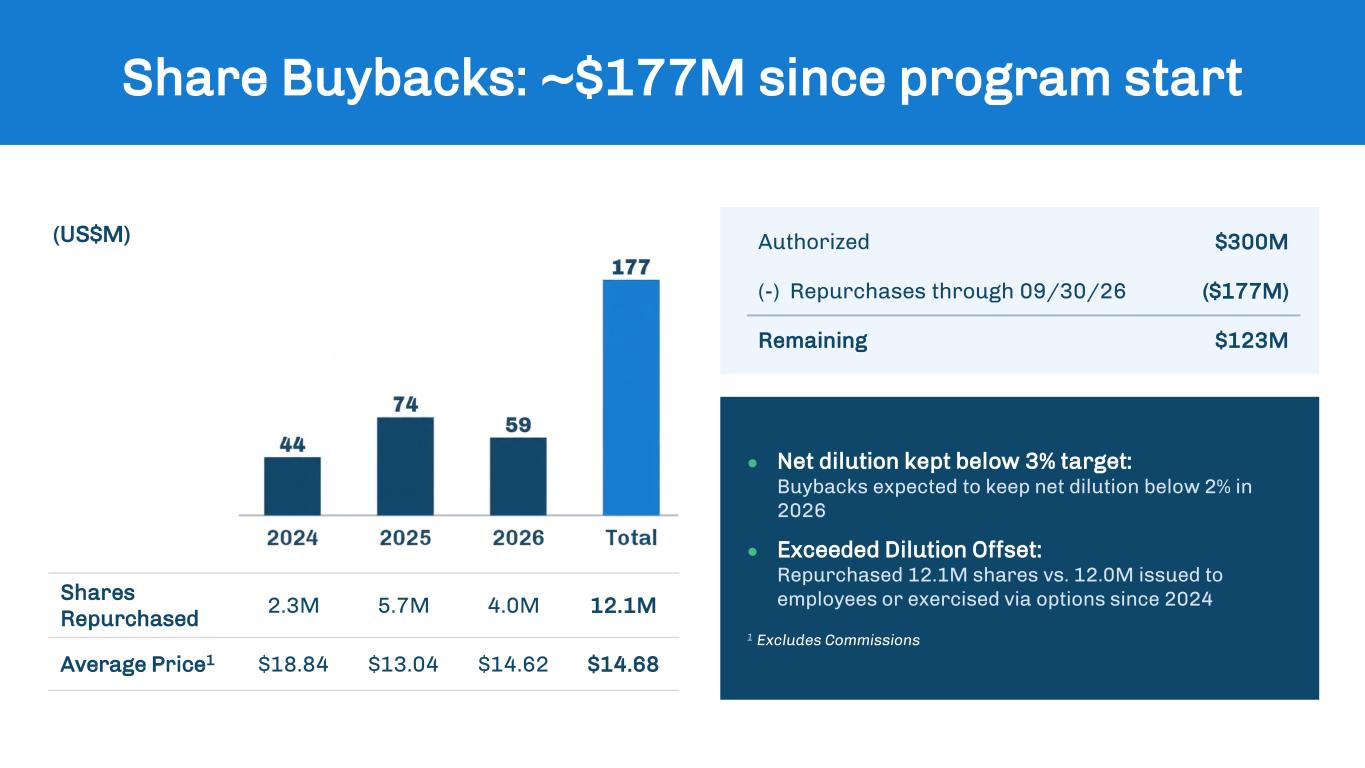
Share Buybacks: ~$177M since program start Authorized $300M (-) Repurchases through 09/30/26 ($177M) Remaining $123M ● Net dilution kept below 3% target: Buybacks expected to keep net dilution below 2% in 2026 ● Exceeded Dilution Offset: Repurchased 12.1M shares vs. 12.0M issued to employees or exercised via options since 2024 (US$M) Shares Repurchased 2.3M 5.7M 4.0M 12.1M Average Price1 $18.84 $13.04 $14.62 $14.68 1 Excludes Commissions

Appendix
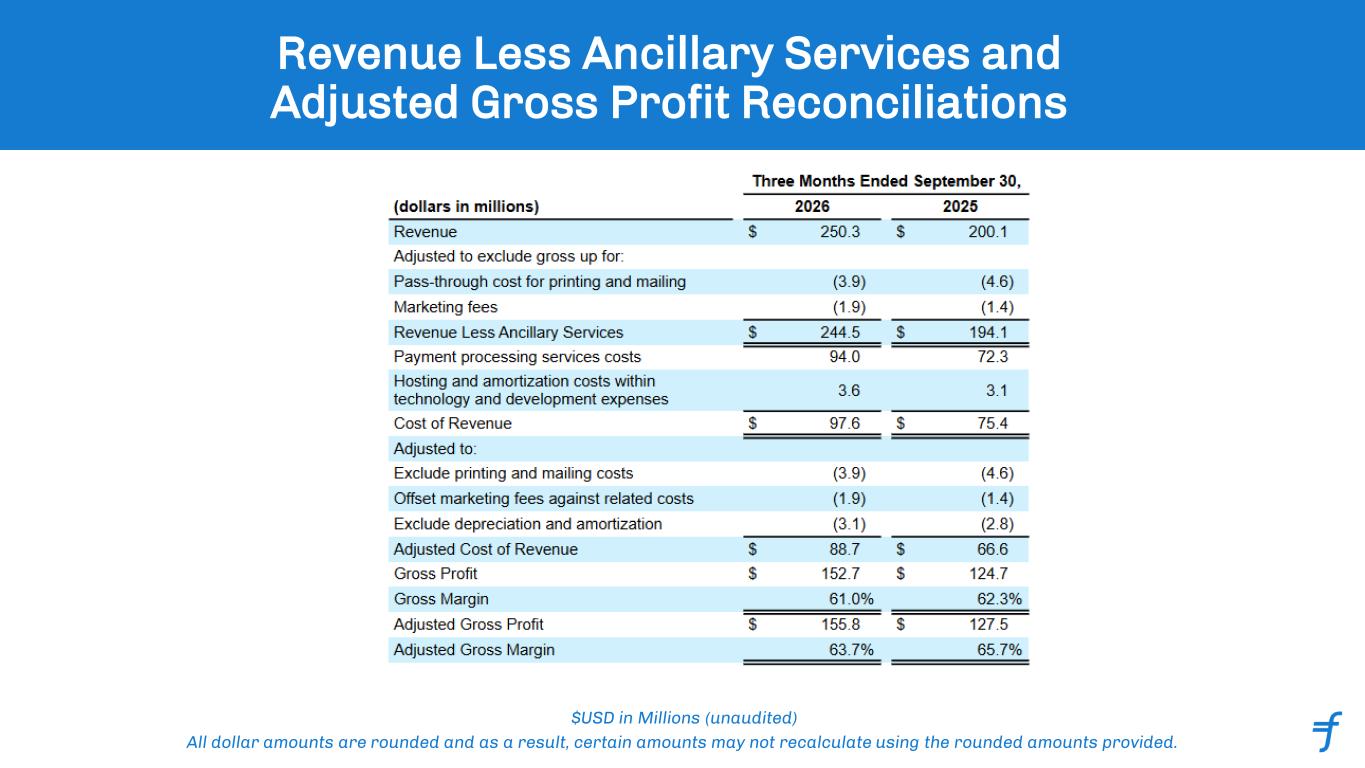
Revenue Less Ancillary Services and Adjusted Gross Profit Reconciliations $USD in Millions (unaudited) All dollar amounts are rounded and as a result, certain amounts may not recalculate using the rounded amounts provided.
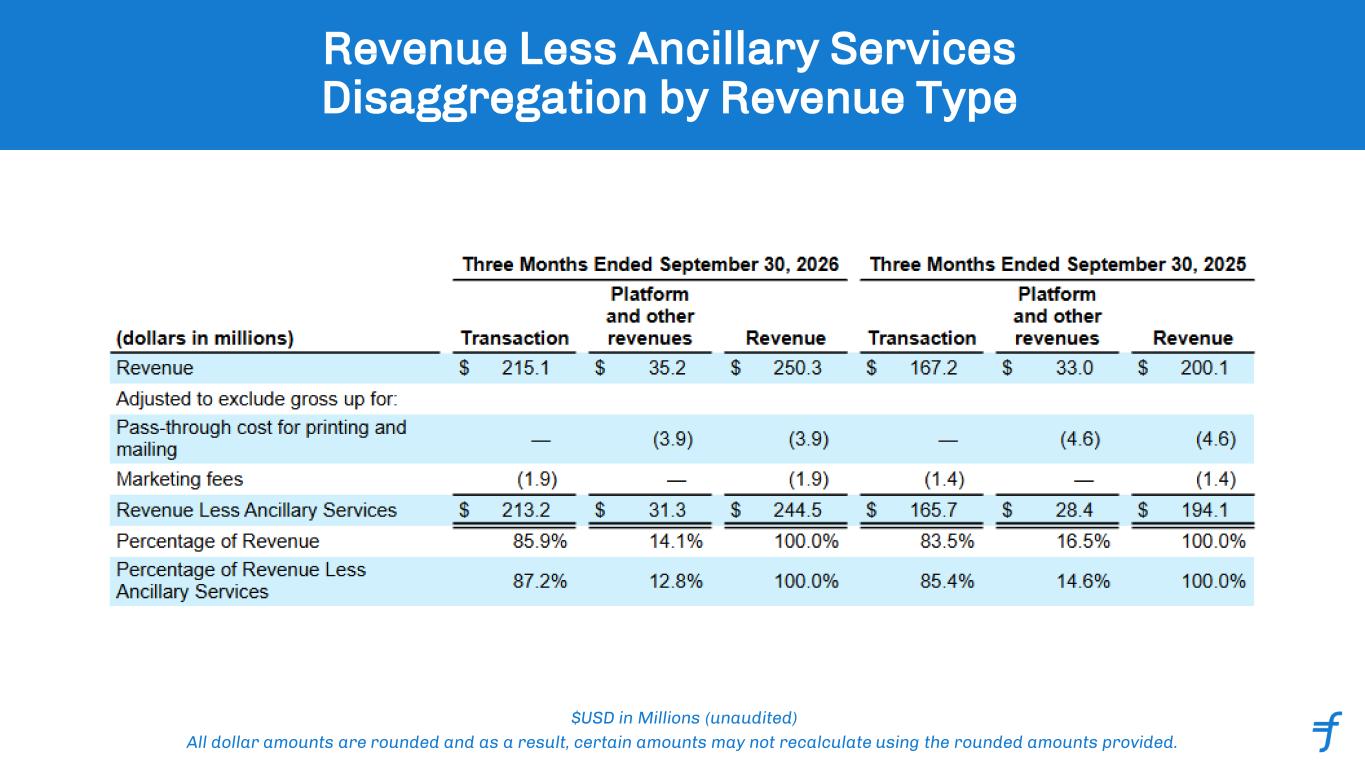
Revenue Less Ancillary Services Disaggregation by Revenue Type $USD in Millions (unaudited) All dollar amounts are rounded and as a result, certain amounts may not recalculate using the rounded amounts provided.
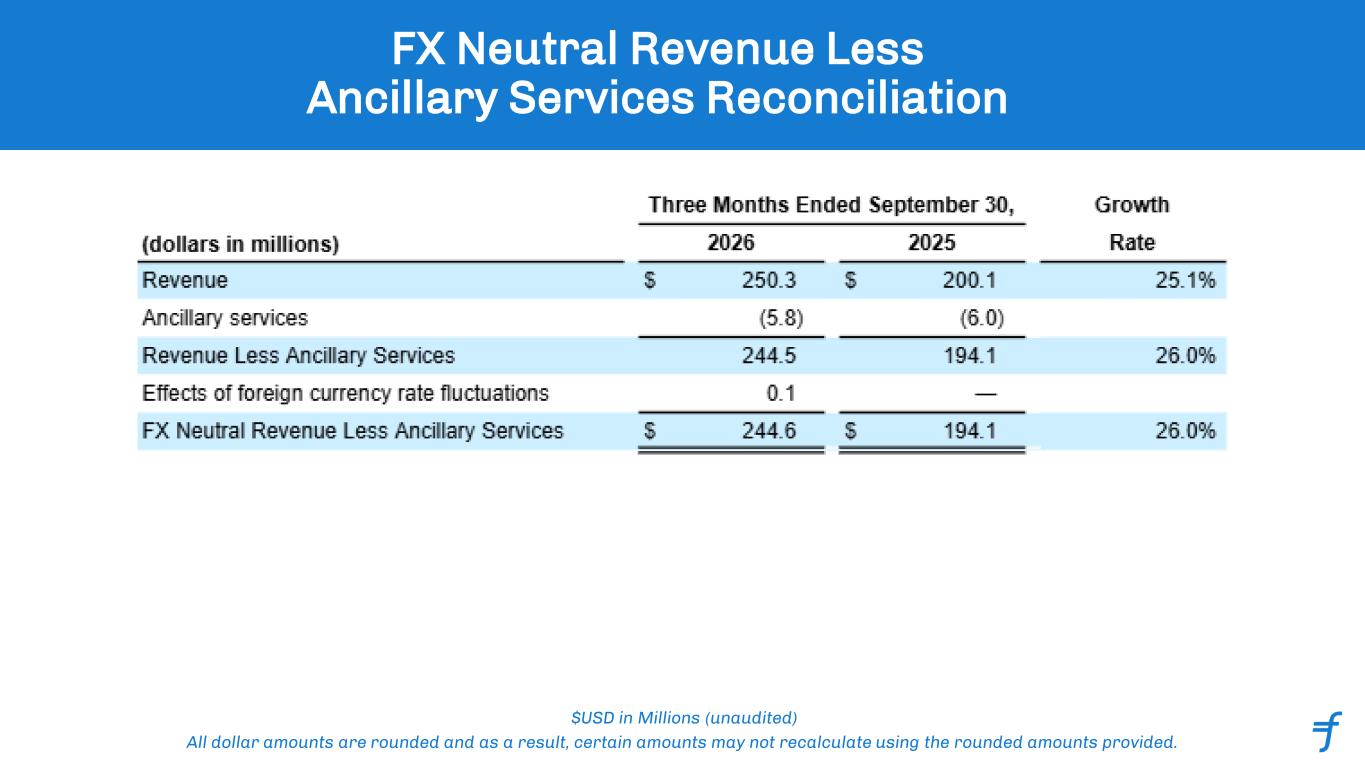
FX Neutral Revenue Less Ancillary Services Reconciliation $USD in Millions (unaudited) All dollar amounts are rounded and as a result, certain amounts may not recalculate using the rounded amounts provided.
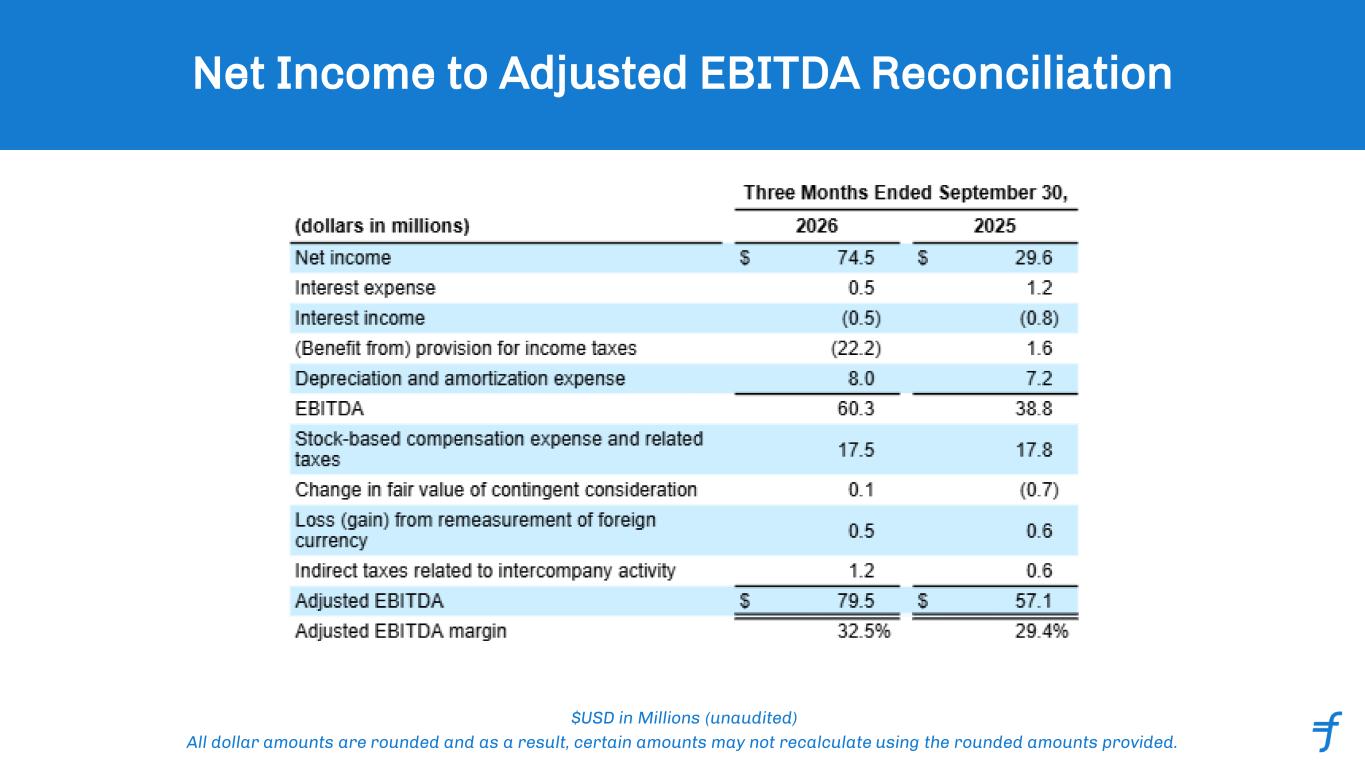
Net Income to Adjusted EBITDA Reconciliation $USD in Millions (unaudited) All dollar amounts are rounded and as a result, certain amounts may not recalculate using the rounded amounts provided.
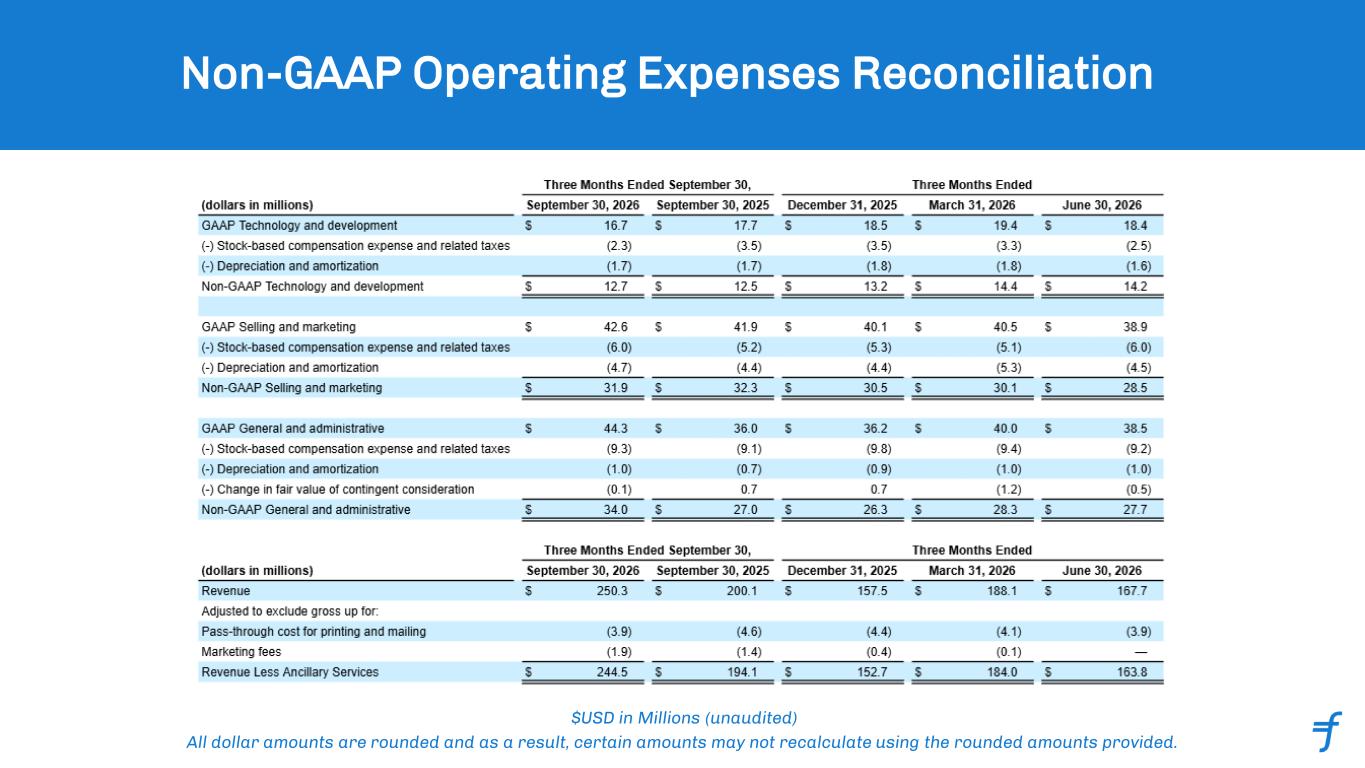
Non-GAAP Operating Expenses Reconciliation $USD in Millions (unaudited) All dollar amounts are rounded and as a result, certain amounts may not recalculate using the rounded amounts provided.
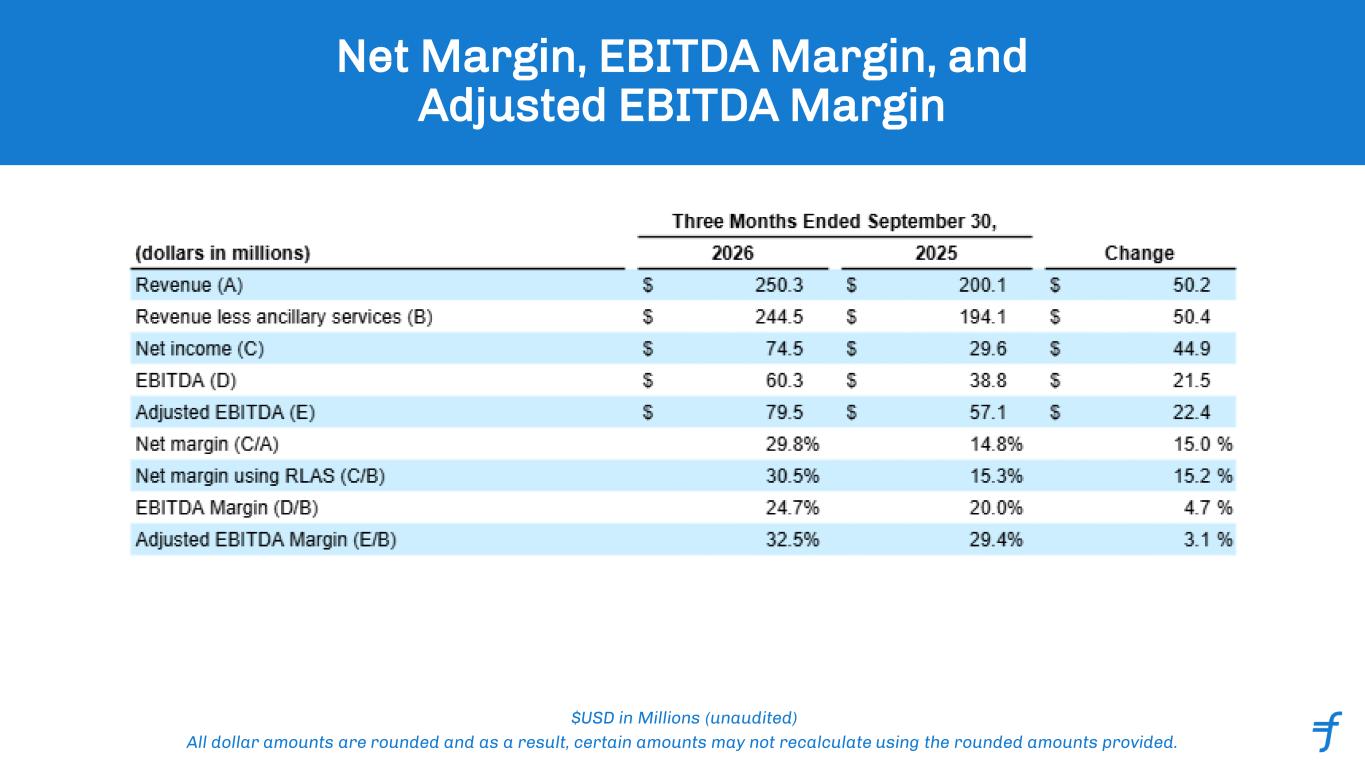
Net Margin, EBITDA Margin, and Adjusted EBITDA Margin $USD in Millions (unaudited) All dollar amounts are rounded and as a result, certain amounts may not recalculate using the rounded amounts provided.
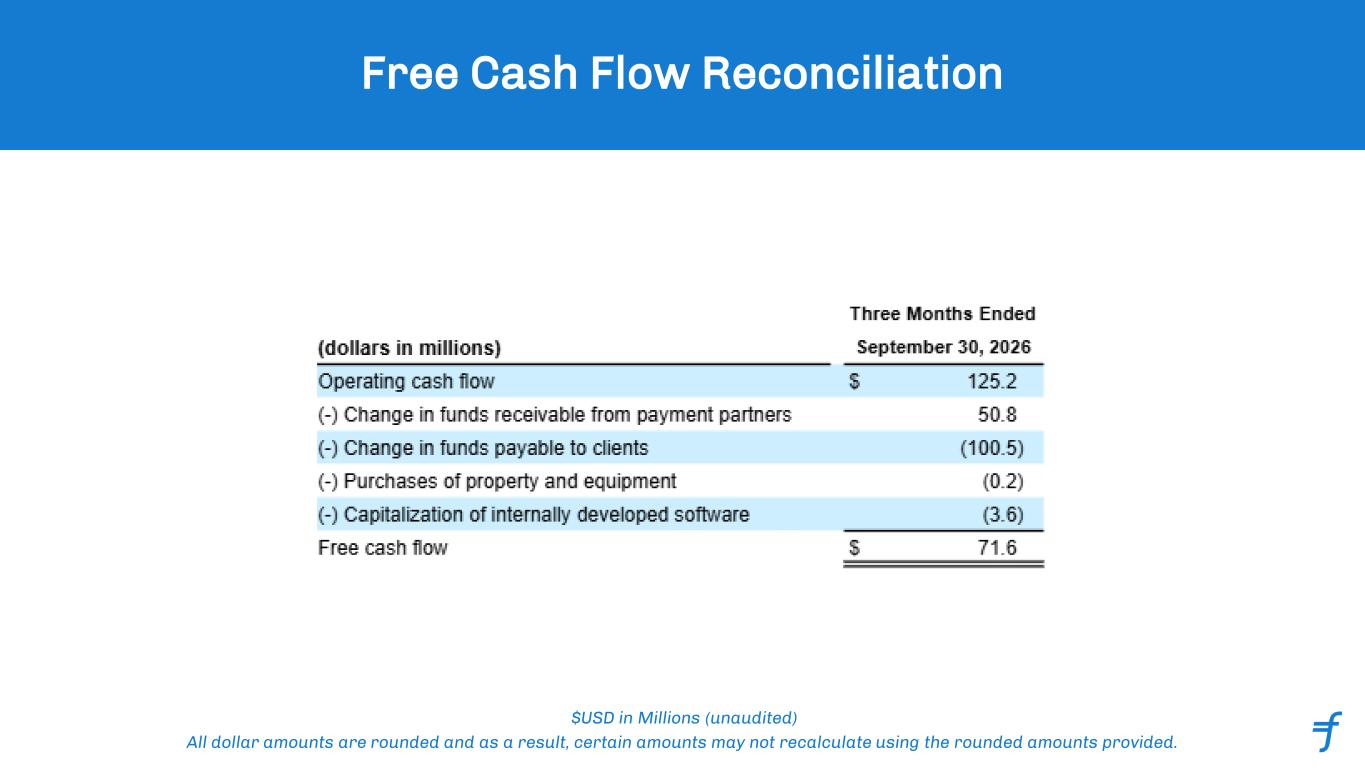
Free Cash Flow Reconciliation $USD in Millions (unaudited) All dollar amounts are rounded and as a result, certain amounts may not recalculate using the rounded amounts provided.
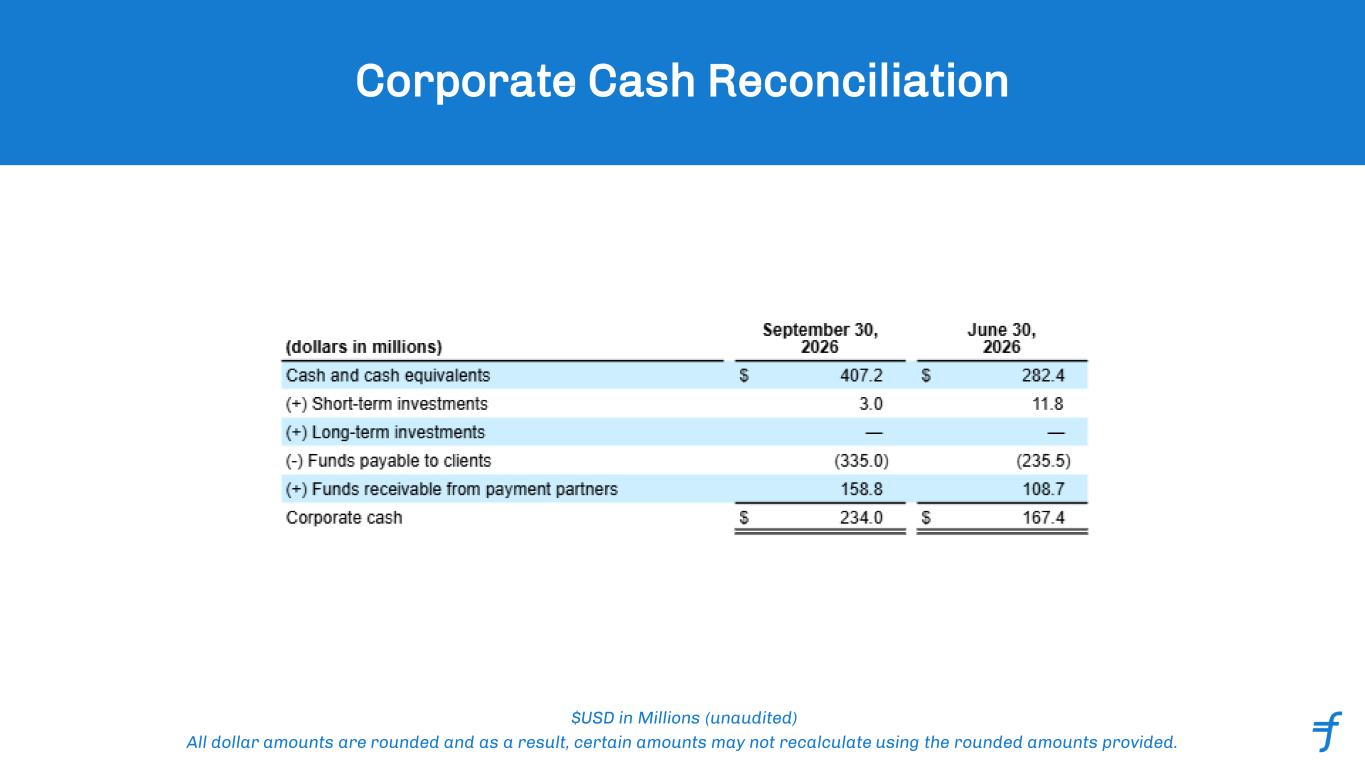
Corporate Cash Reconciliation $USD in Millions (unaudited) All dollar amounts are rounded and as a result, certain amounts may not recalculate using the rounded amounts provided.
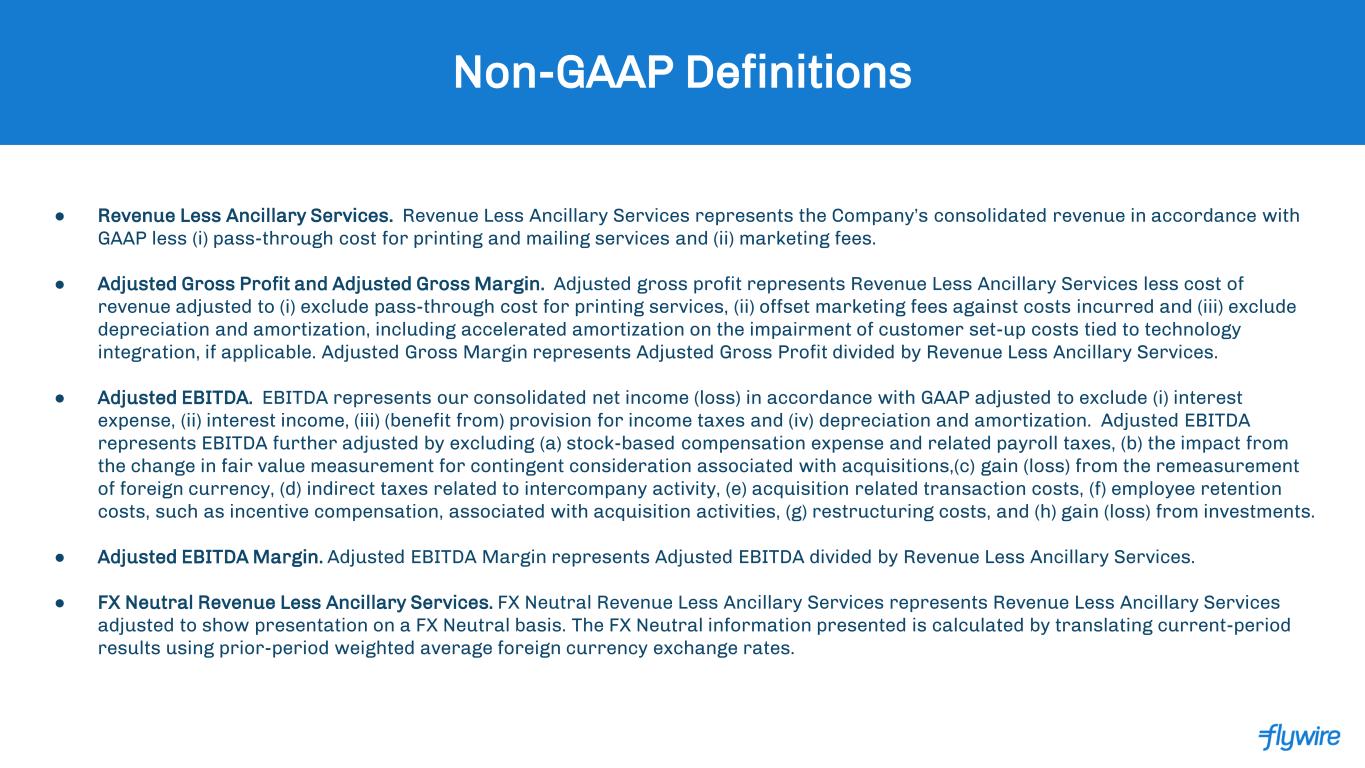
Non-GAAP Definitions ● Revenue Less Ancillary Services. Revenue Less Ancillary Services represents the Company’s consolidated revenue in accordance with GAAP less (i) pass-through cost for printing and mailing services and (ii) marketing fees. ● Adjusted Gross Profit and Adjusted Gross Margin. Adjusted gross profit represents Revenue Less Ancillary Services less cost of revenue adjusted to (i) exclude pass-through cost for printing services, (ii) offset marketing fees against costs incurred and (iii) exclude depreciation and amortization, including accelerated amortization on the impairment of customer set-up costs tied to technology integration, if applicable. Adjusted Gross Margin represents Adjusted Gross Profit divided by Revenue Less Ancillary Services. ● Adjusted EBITDA. EBITDA represents our consolidated net income (loss) in accordance with GAAP adjusted to exclude (i) interest expense, (ii) interest income, (iii) (benefit from) provision for income taxes and (iv) depreciation and amortization. Adjusted EBITDA represents EBITDA further adjusted by excluding (a) stock-based compensation expense and related payroll taxes, (b) the impact from the change in fair value measurement for contingent consideration associated with acquisitions,(c) gain (loss) from the remeasurement of foreign currency, (d) indirect taxes related to intercompany activity, (e) acquisition related transaction costs, (f) employee retention costs, such as incentive compensation, associated with acquisition activities, (g) restructuring costs, and (h) gain (loss) from investments. ● Adjusted EBITDA Margin. Adjusted EBITDA Margin represents Adjusted EBITDA divided by Revenue Less Ancillary Services. ● FX Neutral Revenue Less Ancillary Services. FX Neutral Revenue Less Ancillary Services represents Revenue Less Ancillary Services adjusted to show presentation on a FX Neutral basis. The FX Neutral information presented is calculated by translating current-period results using prior-period weighted average foreign currency exchange rates.
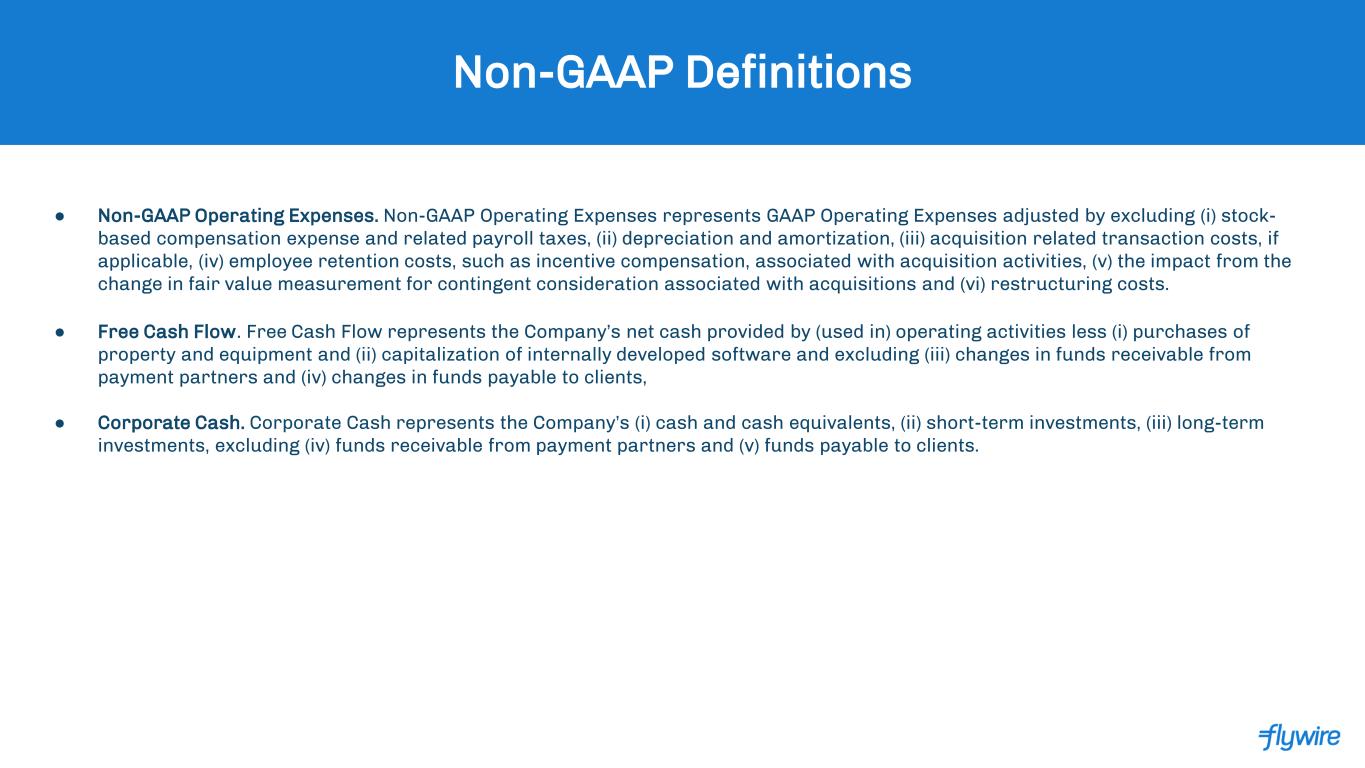
Non-GAAP Definitions ● Non-GAAP Operating Expenses. Non-GAAP Operating Expenses represents GAAP Operating Expenses adjusted by excluding (i) stock- based compensation expense and related payroll taxes, (ii) depreciation and amortization, (iii) acquisition related transaction costs, if applicable, (iv) employee retention costs, such as incentive compensation, associated with acquisition activities, (v) the impact from the change in fair value measurement for contingent consideration associated with acquisitions and (vi) restructuring costs. ● Free Cash Flow. Free Cash Flow represents the Company’s net cash provided by (used in) operating activities less (i) purchases of property and equipment and (ii) capitalization of internally developed software and excluding (iii) changes in funds receivable from payment partners and (iv) changes in funds payable to clients, ● Corporate Cash. Corporate Cash represents the Company’s (i) cash and cash equivalents, (ii) short-term investments, (iii) long-term investments, excluding (iv) funds receivable from payment partners and (v) funds payable to clients.